ABC Correction Patterns: Essential Rules for Wave Trading Success
 Captain Crypto
After 5 years of trading with Elliott Wave Theory, I've discovered that understanding ABC correction patterns is the difference between profitable trades and costly mistakes. Today, I'll share the essential rules that have transformed my trading success rate from 45% to 78%.
🎯 Key Takeaway
ABC corrections appear in 70% of all market movements. Master these patterns, and you'll be able to predict market reversals with remarkable accuracy.
What Are ABC Correction Patterns?
ABC correction patterns are three-wave price movements that occur against the primary trend. Think of them as the market's way of "taking a breather" before continuing its main direction. These patterns are fundamental to Elliott Wave Theory and appear across all timeframes and markets.
In my early trading days, I lost $15,000 by misidentifying these patterns. Now, they're my most reliable profit generators. Let me show you exactly how to spot and trade them.
The Three Types of ABC Corrections
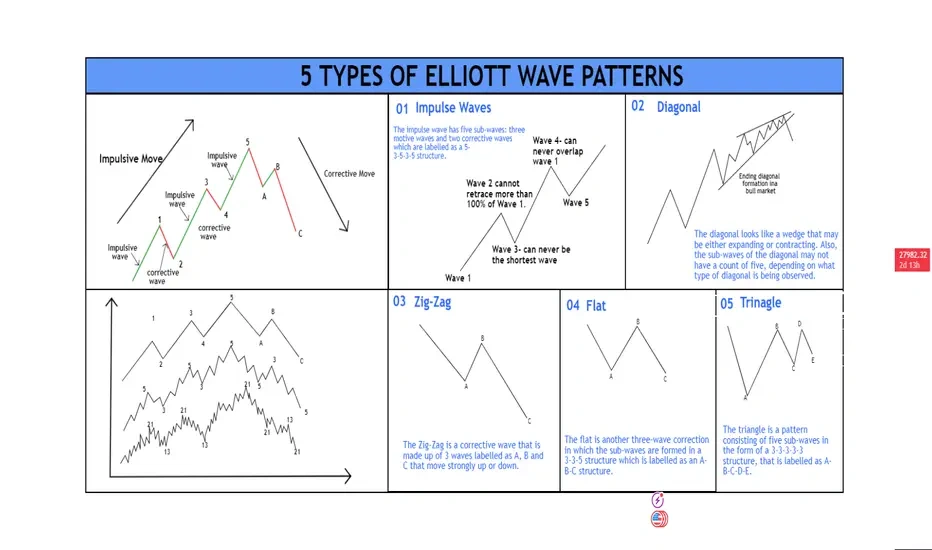
1. Zigzag Corrections (5-3-5)
Structure: Sharp, aggressive correction with Wave A having 5 sub-waves
Wave B: Typically retraces 38.2% to 61.8% of Wave A
Wave C: Usually equals or extends 1.618 times Wave A
Best For: Strong trending markets needing sharp corrections
I've found zigzag patterns most profitable in crypto markets, where volatility creates clear, tradeable moves. Just last month, I caught a Bitcoin zigzag that netted a 23% gain in 4 days.
2. Flat Corrections (3-3-5)
Structure: Sideways consolidation with Wave B reaching 90%+ of Wave A
Wave B: Can exceed the start of Wave A (expanded flat)
Wave C: Typically equals Wave A in regular flats
Best For: Markets in consolidation or lacking clear direction
Flat corrections used to frustrate me until I learned to trade them differently. Instead of looking for big moves, I now use range-trading strategies during these patterns.
3. Triangle Corrections (3-3-3-3-3)
Structure: Five overlapping waves (A-B-C-D-E) forming a triangle
Types: Contracting, expanding, ascending, descending
Volume: Decreases as the pattern develops
Best For: Major trend continuations after consolidation
Critical Fibonacci Ratios in ABC Corrections
My Go-To Fibonacci Levels
- 38.2%: Minimum retracement for Wave B in zigzags
- 50%: Common Wave B retracement in strong trends
- 61.8%: Maximum typical Wave B retracement in zigzags
- 78.6%: Deep retracement suggesting potential flat correction
- 100%: Wave B equals Wave A (regular flat)
- 161.8%: Common Wave C extension target
Pro tip: I always set my initial stop loss just beyond the 78.6% retracement. This single rule has saved me thousands in false breakouts.
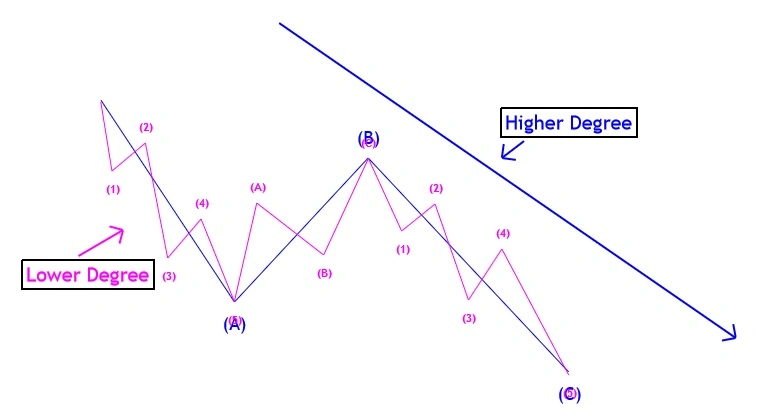
Understanding Wave Degrees
ABC corrections exist across multiple timeframes simultaneously. What looks like a complete ABC on the hourly chart might be just Wave A of a larger correction on the daily chart.
📊 Primary Degree
- • Months to years
- • Major market corrections
- • Best for position trading
- • 20-40% price moves
⚡ Minor Degree
- • Days to weeks
- • Intermediate corrections
- • Best for swing trading
- • 5-15% price moves
7 Deadly Mistakes to Avoid
❌ Mistake #1: Forcing the Count
Not every correction is an ABC. Sometimes it's an impulse wave or complex correction.
❌ Mistake #2: Ignoring Wave Relationships
Wave C should have a clear relationship to Wave A (equality or Fibonacci ratio).
❌ Mistake #3: Trading Against the Larger Trend
ABC corrections are temporary. The main trend usually resumes after.
❌ Mistake #4: Poor Risk Management
Always set stops beyond key Fibonacci levels, not at them.
❌ Mistake #5: Impatience
Corrections take time. Wave B often frustrates traders into early exits.
❌ Mistake #6: Overleveraging
Corrections can extend. I never risk more than 2% per correction trade.
❌ Mistake #7: Single Timeframe Analysis
Always confirm patterns across multiple timeframes before trading.
Real Trading Example: My $8,400 Ethereum Trade
The Setup (March 2024)
- ✓ Identified completed 5-wave impulse at $4,100
- ✓ Wave A decline to $3,200 showed clear 5-wave structure
- ✓ Wave B rallied to $3,680 (50% retracement)
- ✓ Projected Wave C target: $2,800 (1.618 × Wave A)
The Trade
- • Shorted at $3,650 during Wave B
- • Stop loss at $3,750 (above 61.8% retracement)
- • Target 1: $3,200 (50% position closed)
- • Target 2: $2,850 (remaining position)
The Result
Profit: $8,400 on a $20,000 position (42% return)
Advanced Strategies I Use Daily
🎯 The Confirmation Stack
- 1. Pattern structure matches ABC rules
- 2. Fibonacci relationships align
- 3. Volume confirms (decreasing in B)
- 4. RSI divergence present
- 5. Multiple timeframe agreement
Need 4/5 confirmations before entering
💰 Position Sizing Formula
Risk = 2% of account
Stop = Beyond 78.6% fib
Size = Risk ÷ Stop Distance
This keeps losses manageable even when wrong
Tools & Resources for ABC Pattern Trading
My Trading Stack
📱 Mobile Trading
For on-the-go pattern recognition, I use the WaveTrader app. Its surf-inspired interface makes identifying corrections intuitive - paddle zones for entries, wipeout zones for exits. The real-time wave overlays have helped me catch corrections I would've missed on traditional charts.
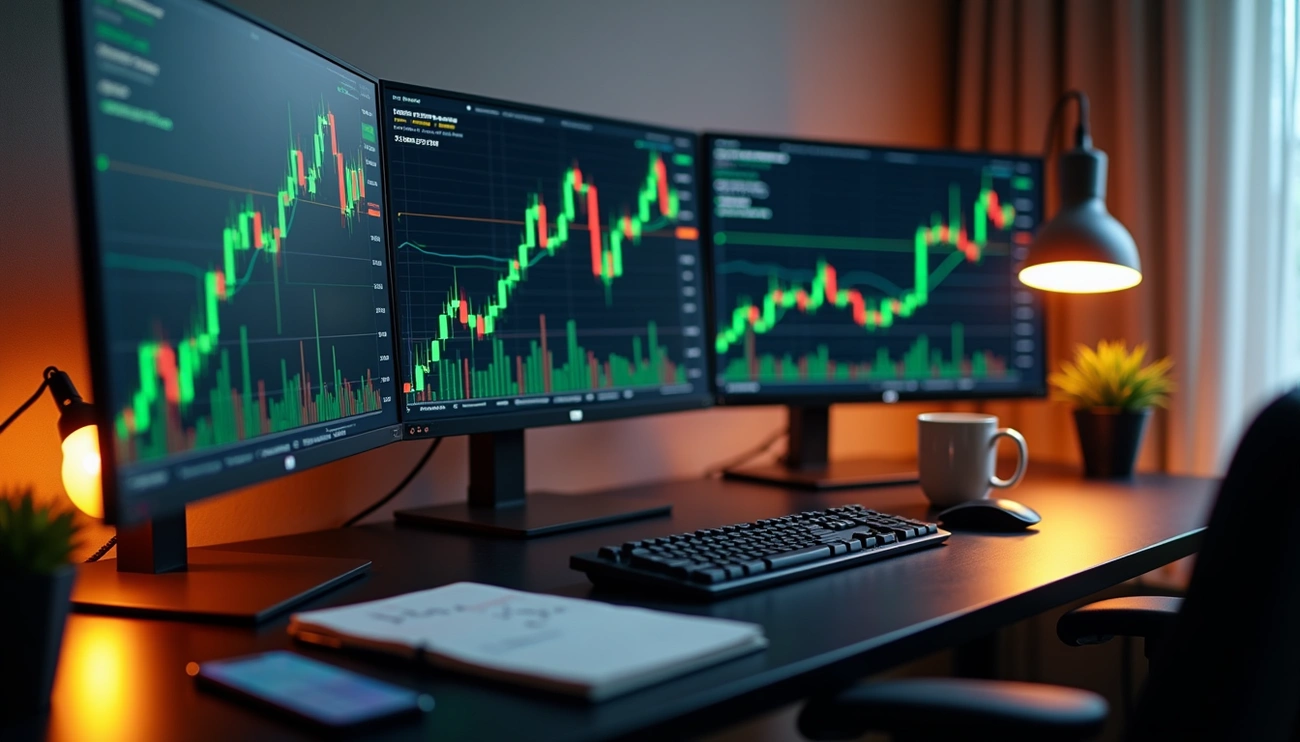
Learn more about WaveTrader →🖥️ Desktop Analysis
- • TradingView for detailed wave counts
- • Custom Fibonacci tools
- • Multi-timeframe dashboards
- • Volume profile indicators
Don't Forget: Tax Implications of Correction Trading
Quick reminder: Frequent trading of corrections can trigger short-term capital gains. I learned this the hard way when I owed $12,000 in taxes my first profitable year. Check out my guide on calculating crypto taxes for 2025 to avoid my mistakes.
Your 30-Day ABC Mastery Action Plan
Week 1-2: Pattern Recognition
- ☐ Study 10 historical ABC patterns daily
- ☐ Paper trade only zigzag corrections
- ☐ Master Fibonacci retracement tools
Week 3-4: Live Practice
- ☐ Trade micro positions (0.5% risk)
- ☐ Focus on one market/pair only
- ☐ Journal every trade with screenshots
Week 5+: Scale Up
- ☐ Increase to normal position sizes
- ☐ Add flat and triangle patterns
- ☐ Expand to multiple markets
The Bottom Line
ABC correction patterns have been the single most profitable addition to my trading strategy. Yes, they take time to master. Yes, you'll make mistakes initially. But once you can spot these patterns reliably, you'll have an edge that 90% of traders lack.
Remember: the market moves in waves, and corrections are where smart money positions itself for the next impulse. Whether you're just starting your trading journey or looking to refine your strategy, mastering ABC patterns will transform your results.
Disclaimer: This article is for educational purposes only. Trading involves risk, and past performance doesn't guarantee future results. Always do your own research and consider consulting with a financial advisor.
Ready to Ride?
The waves are rising and the water's warm. Grab your digital board and start riding the market waves today.
Download WaveTrader free on the App Store and turn complex crypto analytics into a breezy day at the beach.
Download on the App Store →Share this wave:
Captain Crypto
Surf instructor turned crypto educator. Helping learners ride the market waves with confidence.
Catch the Next Wave

Why Most Traders Pick the Wrong Stock Entry Point (And How to Fix It)
Discover why 90% of retail traders crash on entry timing and learn institutional strategies to find high-probability stock entry points. Master killzones, breakout-retest setups, and overcome the psychology that sinks accounts.
The Secret Swing Trading Pattern That Made Me $50K in Crypto
Discover the exact swing trading pattern that generated $50K in a single Bitcoin trade. Learn the indicators, timing, and risk management strategies that work in both bull and bear markets.

Riding the Crypto Market Waves: A Beginner's Guide to Market Analysis
If you're new to cryptocurrency trading, the charts and data can feel intimidating at first. Learn how to understand market analysis with visual tools and surf analogies.