
Quick Answer
"Sell in May and go away" is a Wall Street saying, not a Bitcoin rule. Since 2013, BTC has finished May green about 60% of the time with an average return near +7.8%. In May 2026, Bitcoin reclaimed $80,000 on the 4th and Tom Lee called the bear market over if BTC closes the month above $76K. The right move isn't to dump on the calendar. It's to read whether your chart is still in a Paddle Zone or actually flipping into a Wipeout Zone.
 Image Source: Unsplash
Every spring, the same headlines roll back in like clockwork. "Sell in May and go away." "Is the top in?" "Time to take chips off the table?" Old Wall Street says paddle out in November and ride the wave through April. But this isn't 1885. The crypto ocean has new currents now. Bitcoin spot ETFs, the CLARITY Act, AI coaches like Kai. A green Paddle Zone in May 2026 doesn't automatically wipe out into an orange Down Crash just because the calendar flipped to summer. Let's separate the saying from the signal.
🔑 Key Takeaways
- "Sell in May" is borrowed wisdom: The saying comes from London and Wall Street equities, where summer volume thinned out. Crypto trades 24/7 and is now ETF-driven, so the seasonal mechanic doesn't translate cleanly.
- Bitcoin's May record is mostly green: 8 of the past 13 Mays closed positive, with average return around +7.8%. May 2017 and May 2019 each printed +52% gains.
- The red Mays were real and ugly: May 2018 (-19%), May 2021 (-35%), and May 2022 (-15%) all hurt. Each came after specific structural breaks, not because of the date.
- May 2026 has both a bull case and a bear case: $80K reclaim and a 9-day ETF inflow streak vs. Crypto Rover and DefiTracer warnings if BTC loses the $79.5K-$80K shelf. The monthly close is what settles it.
- Trade the chart, not the calendar: A Paddle Zone with higher lows and inflows is not a Wipeout Zone. Wait for actual confirmation before you panic-sell into the date.
Where "Sell in May" Came From (and Why It Was Never About Bitcoin)
The full version of the adage is "Sell in May and go away, come back on St. Leger's Day." It started in 18th century London, when wealthy bankers and merchants would leave the city for the summer to escape the heat. Trading desks emptied out, volume dried up, and they'd return for the St. Leger horse race in September. Wall Street picked up a softer version in the 20th century because the S&P 500 genuinely did underperform between May and October on average.
Notice what that story isn't about. It's not about a planetary force pushing prices down on May 1. It's about who happens to be at their desk and how much volume they're moving. The minute the mechanism changed (24/7 markets, algorithms, ETFs, retail in pajamas at 3am), the seasonality story got a lot weaker.
Crypto is the cleanest example of why. Bitcoin doesn't take a summer holiday. There's no Hamptons house for BTC. Spot ETF flows now run on the same NYSE clock as everything else, and on-chain settlement is a 24/7 firehose. If you're looking for a "the calendar said so" signal in crypto, you're going to be looking for a long time. If you're brand new to all this and want the basics first, our beginner's guide to market analysis walks through the building blocks without the jargon.
Bitcoin's Real May Track Record Since 2013
Here's where the data does the talking. Looking at every May from 2013 through 2025 using CoinGlass and CoinDesk data, May has finished green in roughly 8 of 13 years. Average return: about +7.8%. Median: about +6.3%. Positive 60% of the time. That's not "sell on sight." That's "above average month."
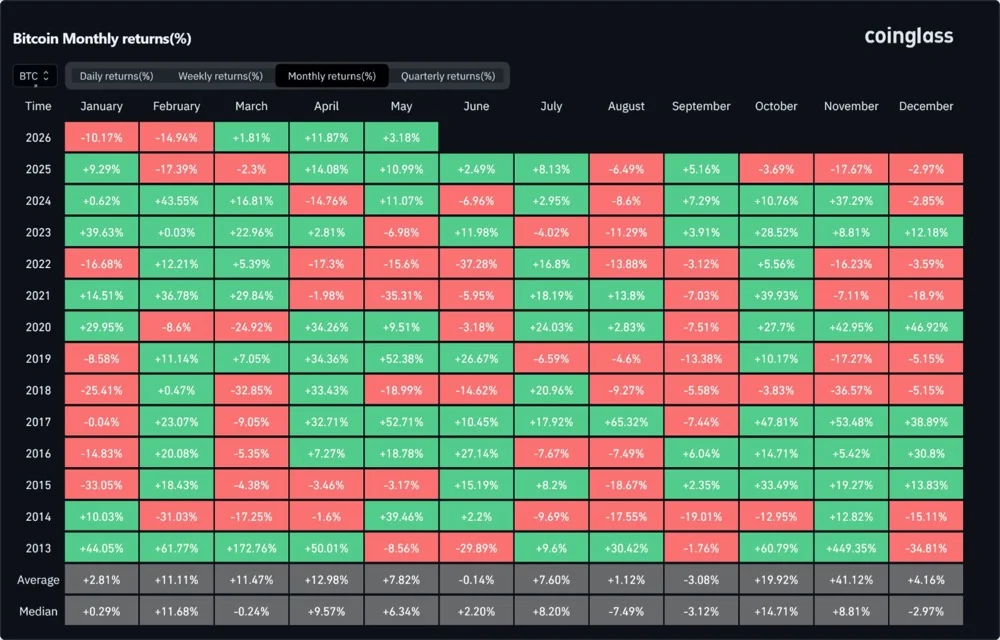 Image Source: @Trader_XO via NewsBTC
The big green Mays
- 🟢 May 2014: +39%, finishing the month at $623.
- 🟢 May 2016: +18%, the calm before Bitcoin's first parabolic year.
- 🟢 May 2017: +52%, the start of the run that ended at $20K in December.
- 🟢 May 2019: +52% again, and the only time in BTC history that March, April, and May were all green back-to-back.
The red Mays that hurt
- 🔴 May 2018: -19%, the slow-bleed down move after the December 2017 top.
- 🔴 May 2021: -35%, triggered by Elon's energy tweet, China mining ban news, and a leverage flush.
- 🔴 May 2022: -15%, when Terra/Luna collapsed and dragged the entire market into a Down Crash.
Read the red Mays carefully. None of them happened because of May. They happened because of structural breaks: a parabolic top exhausting, a leverage cascade, a systemic stablecoin failure. The calendar was just where the news landed.
🏄 Pro Surfer Tip
Seasonality is a tailwind or headwind, never a signal on its own. Use it to size your conviction up or down, not to enter or exit. The actual signals come from price structure, volume, and flows. Our guide to break signals covers what real confirmation looks like.
What's Actually Happening in May 2026
So where does that leave us right now? Pretty interesting place, honestly. Bitcoin reclaimed $80,000 on May 4 for the first time since January 31, riding into Consensus Miami on a wave of institutional money. The catalyst wasn't a single tweet or pump. It was nine consecutive trading days of net spot ETF inflows from April 14 through April 23, totaling roughly $2.7 billion in three weeks. The ETF complex absorbed about 19,000 BTC during that stretch, roughly nine times what miners produced in the same window.
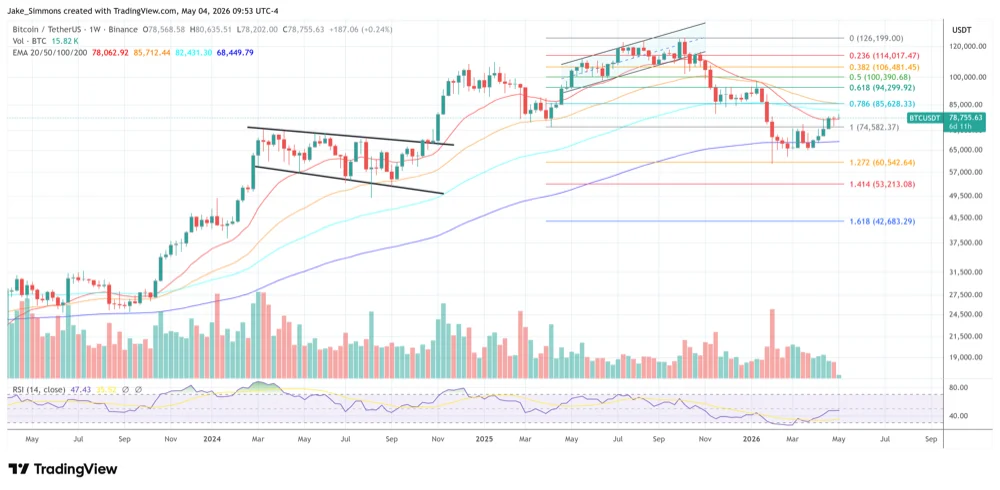 Image Source: TradingView via NewsBTC
The bull case: Tom Lee's three-month rule
Speaking at Consensus 2026 in Miami on May 7, Fundstrat's Tom Lee made a specific call. If Bitcoin closes May above $76,000, the bear market is "definitively" over. His reasoning is based on what he called the three-month rule: in past Bitcoin bear markets, you'll see one or two-month dead-cat bounces, but never three consecutive green months. April 2026 closed at $76,300 per the CoinDesk Bitcoin Price Index. A green May on top of green March and April would be the first such streak in this cycle, and historically a structural confirmation. Lee also bumped his year-end BTC target to $150K-$250K and ETH to $9K-$22K. Take those bigger numbers with however much salt you prefer.
The bear case: $79.5K-$80K is the line
On the other side, traders like Crypto Rover and DefiTracer have been flagging 2018-style structural risk if Bitcoin fails to hold the $79,500 to $80,000 shelf. The April 2026 high was around $79,500. If May closes back below that level on rising volume, you've got a textbook lower high inside a downtrend. That's the setup that triggered the slow bleed of mid-2018, and it's the scenario that turns a friendly Paddle Zone into a hostile Wipeout Zone fast.
Bull Case
Monthly close above $76K confirms three straight green months. ETF flows already proved demand. Up Swell continues into summer.
Bear Case
Loss of $79.5K-$80K on rising volume prints a lower high. 2018-style slow-bleed Down Crash takes over the chart.
Notice what both sides agree on. Neither says "sell on May 1 because of the saying." Both are watching specific price levels and specific structural confirmations. That's the difference between trading and astrology.
Paddle Zone vs. Wipeout Zone: Translating the Question
This is where WaveTrader's visual language earns its keep. The whole "is this the top?" panic that hits every May (and every parabolic October, for that matter) reduces to one cleaner question: am I in a Paddle Zone or a Wipeout Zone?
Paddle Zone
A price area where the chart is making higher lows, demand is absorbing supply, and momentum is rebuilding. It's where surfers paddle out to catch the next wave. In WaveTrader, Paddle Zones light up green on the chart so you can see them at a glance instead of squinting at indicators.
Wipeout Zone
A price area where the chart is printing lower highs, supply is overwhelming demand, and longs keep getting flushed. It's the part of the wave where surfers get tossed off their boards. WaveTrader paints these red so you don't get caught on the wrong side of the swell.
When does a Paddle Zone actually flip to a Wipeout?
A real flip needs more than one scary candle. Look for a stack of these five signals to line up before you treat the move as a structural break instead of just noise.
Structural break
A clean lower low on the daily timeframe, not just an intraday wick that gets bought back before the close.
Volume confirmation
The breakdown happens on rising volume, not a thin sleepy session that nobody is paying attention to.
Flow reversal
Spot ETF inflows turn into multi-day outflows. The buyers stop showing up and the demand engine cuts out.
Momentum failure
Bounces get sold quickly and never reclaim prior support. Each rally fades faster than the last.
Sentiment crack
Fear and Greed flips into fear and stays there for days, not hours. The mood of the market changes, not just the price.
Signal #3 in particular is doing more structural work than it used to. Our deep dive on the altcoin ETF wave explains why spot flow is now a leading indicator for crypto rather than an afterthought.
If you've got one of these signals, you've got noise. If you've got three or four, you've got a real Wipeout Zone forming and it's time to manage risk. The 2018 May breakdown checked all five boxes. The May 2021 wipe was even faster, with leverage doing the work in 48 hours. May 2026 hasn't checked any of them yet at the time of writing. That's not a guarantee, just a data point.
For the deeper mechanics on how these flips actually start (and why most traders see them too late), our breakdown on entry timing goes through the institutional patterns that flip Paddle Zones into Wipeout Zones in the first place.
Kai's Calm vs. Panic Checklist
Here's the part to actually save and re-read every time the seasonal headlines start hitting. Kai, our AI surf analyst, gets variations of these questions all month long. They're the ones that separate the surfers who ride the wave from the ones who paddle home before the swell arrives.
Is the chart actually broken?
Pull up your weekly timeframe. Are higher lows still intact? If yes, you're inside an Up Swell that's pulling back, not in a Wipeout Zone. The swell isn't the wipeout.
What are the flows doing this week?
Multi-day spot ETF inflows are a structural signal. Multi-day outflows are too. Check before you panic-sell into a green flow week.
Did your thesis change, or did the price?
If a 5% red day broke your conviction, your conviction was probably built on hope, not a thesis. A real thesis can survive a normal pullback inside an Up Swell.
Are you reacting to a chart or to a headline?
"Sell in May" is a headline. The chart is the chart. If you can't point to a specific level that's broken, you're trading vibes.
If you sell now, what's the plan to buy back?
If your answer is "I don't know, lower," you're not selling on a signal. You're selling on fear and you'll watch the next leg up from the sidelines.
Have your stops moved with the trend?
If you're worried about a drawdown, the answer isn't to sell everything. It's to make sure your stop loss reflects the new structure. Trail it, don't yank it.
The traders who hold through May 2026 with their sanity intact are the ones answering these questions before they touch a sell button. The ones panicking on the calendar are the ones reading a headline from 1885 and applying it to a 24/7 market with $100B+ in spot ETF AUM. We covered the deeper psychology behind that gap in our piece on market cycle psychology if you want to keep going.
The Bottom Line
"Sell in May and go away" is a charming saying with a real history and a weak case in 2026 crypto. Bitcoin's actual May data is positive more often than not. The structural mechanics that hurt the bad Mays (parabolic exhaustion, leverage cascades, stablecoin blowups) aren't visible on the chart right now. The flows are bullish. The Tom Lee three-month rule is in play. And the bears have a clear, specific level to defend ($79.5K-$80K) instead of a vague calendar argument.
So no, you probably shouldn't dump your stack because the month flipped to May. You should watch the close. You should respect the level. You should trail your stops. And you should let the chart, not the calendar, tell you whether you're in a Paddle Zone or a Wipeout Zone.
If May 2026 closes red below $76K with outflow streaks confirming, that's a different conversation. We covered exactly how to handle that scenario in our guide to trading the correction, and that playbook still holds. But until the close prints, the wave is still the wave. Stay on the board.