Quick Answer
Bitcoin dropped 44% from its $126K all-time high and the Fear & Greed Index spent 46 straight days in Extreme Fear. Smart traders are responding with tiered DCA into the $60K-$70K Paddle Zone, watching capitulation signals like exchange reserve drawdowns, and using disciplined stop losses to protect existing positions. This isn't the time to panic. It's the time to prepare for the next swell.

You've been watching your portfolio bleed for weeks. Every morning you check the charts, and every morning it's the same gut punch: more red. Bitcoin sitting at $70K feels surreal when just five months ago it touched $126,000. Here's the thing though. Every surfer knows the ocean doesn't stay flat forever, and the biggest rides come after the deepest troughs. Let's talk about exactly what's happening, why it's more normal than it feels, and how to trade through it with your capital (and your sanity) intact.
🔑 Key Takeaways
- This correction is painful, but historically normal: BTC has pulled back 30-80% in every single cycle before setting new highs. A 44% drop is textbook.
- Dollar-cost average into the Paddle Zone: Split your buying budget across the $60K-$70K range instead of trying to nail the exact bottom.
- Watch the capitulation signals: Exchange reserves are at their lowest since 2018 and ETF flows are turning. These are the on-chain clues that tell you when fear is peaking.
- Manage existing positions before opening new ones: Set stop losses, right-size your exposure, and define your exit plan before the market makes the decision for you.
- Your psychology is the real battleground: Revenge trading and panic selling destroy more portfolios than any correction ever will.
What's Actually Happening: The 2026 Correction in Context
Let's lay out the numbers, because the numbers matter more than the panic on Crypto Twitter.
Bitcoin hit its all-time high of $126,000 in October 2025, capping a legendary run fueled by spot ETF inflows, the halving cycle, and institutional FOMO. Fast forward to April 2026 and BTC is hovering around $70,000. That's a 44% drawdown from the peak. Over $1.2 trillion in total crypto market cap has evaporated, and one particularly brutal session wiped out $19 billion in leveraged positions in a single day.
The Crypto Fear & Greed Index tells the emotional story. It spent 46 consecutive days in "Extreme Fear" territory, hitting readings as low as 5 out of 100. To put that in perspective, the index only touched single digits twice during the 2022 bear market. This time, it's been camped there for over a month.
If you're feeling rattled, you're not alone. But understanding ABC correction patterns and how they play out can help you see this chaos for what it really is: a cycle doing exactly what cycles do.
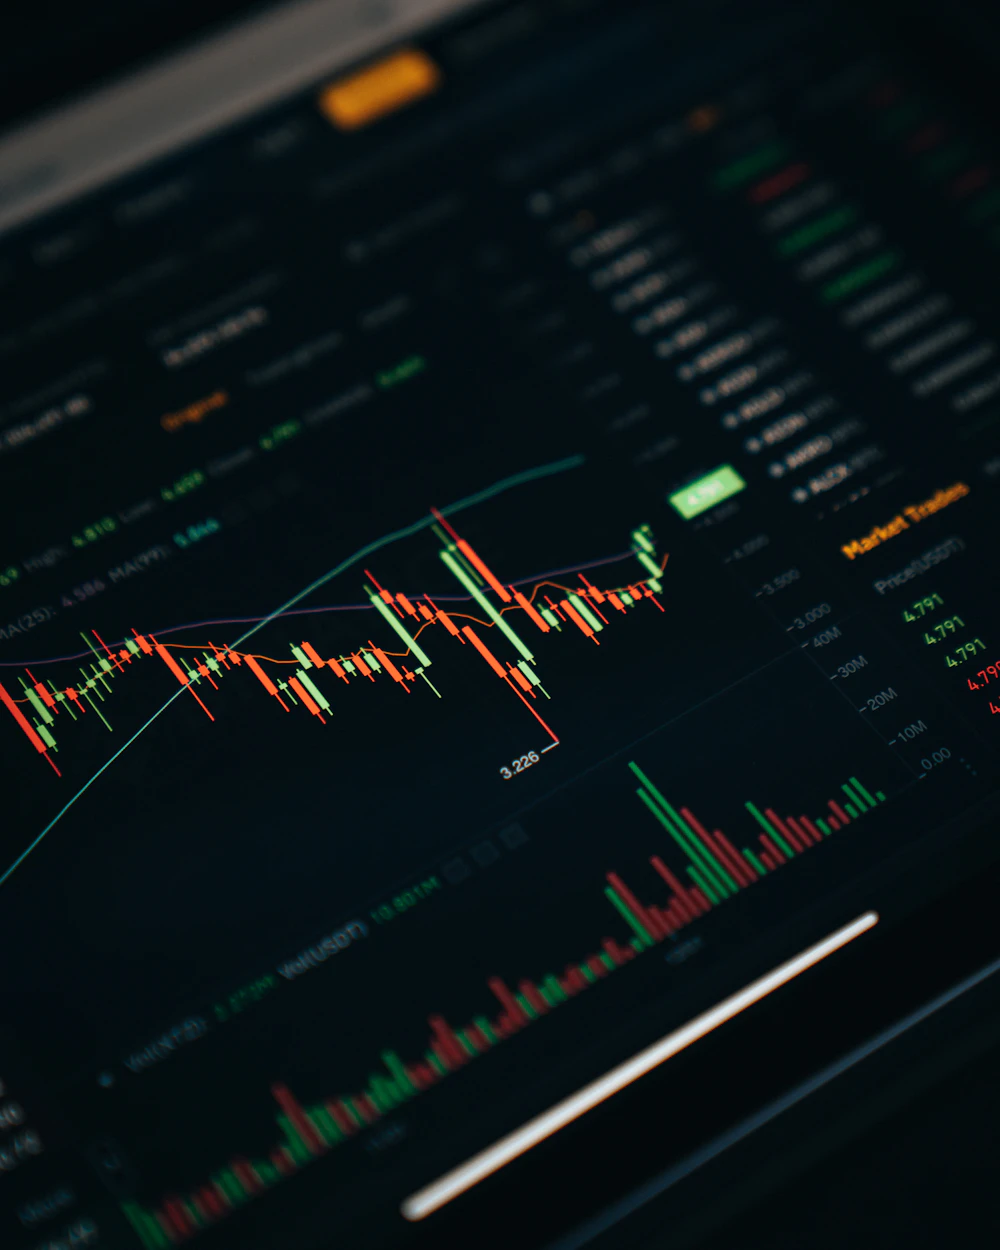 Image Source: Unsplash
Why Corrections Are Normal (Even This One)
Here's something that gets lost in the noise: Bitcoin has crashed harder than this before. Multiple times. And every single time, it came back stronger. Let's look at the receipts.
| Year | Peak | Trough | Drop | Recovery Time |
|---|---|---|---|---|
| 2014 | $1,150 | $170 | -85% | ~3 years |
| 2018 | $19,800 | $3,200 | -83% | ~3 years |
| 2021 (mid-cycle) | $64,000 | $29,000 | -54% | ~4 months |
| 2022 | $69,000 | $15,500 | -77% | ~2 years |
| 2025-2026 | $126,000 | ~$70,000 | -44% | Ongoing |
See the pattern? A 44% correction after a massive run is actually moderate by Bitcoin standards. The 2018 crash destroyed 83% of BTC's value. The 2022 wipeout took it down 77%. If you're reading this article during a 44% pullback, you're living through one of the shallower corrections in Bitcoin's history.
That doesn't mean it can't go lower. It absolutely can. But it does mean that the "crypto is dead" headlines you're seeing right now have been wrong every single time before. Understanding market cycle psychology is your first line of defense against making permanent decisions based on temporary emotions.
🏄 Pro Surfer Tip
Every experienced surfer has been caught inside a massive set and pushed to the bottom. The difference between a pro and a beginner? The pro doesn't fight the current. They relax, conserve energy, and resurface when the turbulence passes. Same goes for your portfolio.
Strategy 1: Dollar-Cost Averaging Into the Paddle Zone
If you're sitting on cash and wondering whether now is the right time to buy, the honest answer is: nobody knows the exact bottom. Not you, not the analysts, not the influencers on YouTube with the red-circle thumbnails. But that doesn't mean you have to sit on the sidelines entirely.
Dollar-cost averaging (DCA) is the simplest strategy that actually works during corrections. Instead of trying to paddle out at the perfect moment, you wade into the water gradually. You buy a fixed amount at regular intervals, regardless of where the price sits that day.
A Tiered DCA Setup for the Current Correction
Rather than plain DCA (same amount every week), a tiered approach lets you buy more aggressively at lower prices. Here's a framework based on the current $60K-$70K Paddle Zone:
Tier 1: $68K-$72K (current range)
Deploy 25% of your buying budget. You're accumulating at prices that are already 44% below the ATH. Not the cheapest entry, but historically these mid-correction levels have been profitable within 12-18 months.
Tier 2: $60K-$68K (deeper support)
Deploy another 25%. The $60K-$65K range is where multiple technical indicators converge: the 200-week moving average, the previous cycle's breakout level, and a major Fibonacci retracement zone. If BTC touches this range, you want to be buying.
Tier 3: Keep 50% in reserve
This is your dry powder. If we get a capitulation wick below $60K (like the flash crash to $29K in mid-2021), you'll be glad you saved half your ammunition for the deepest discount. Patience is a trading strategy.
The beauty of DCA is that it removes the emotional guesswork. You don't need to predict the bottom. You just need a plan and the discipline to follow it. If you want a deeper dive into bear market accumulation techniques, our bear market survival guide covers the fundamentals.
Strategy 2: Reading the Capitulation Signals
DCA is your bread and butter, but if you want to refine your timing, on-chain data gives you something no price chart can: a look at what people are actually doing with their coins, not just what the price says.
Exchange Reserves Are at Their Lowest Since 2018
When traders are scared, they move coins to exchanges to sell. When conviction returns, coins flow back to cold storage. Right now, exchange reserves for Bitcoin are at their lowest level since 2018. That means long-term holders are pulling BTC off exchanges and locking it away. They're not selling. They're accumulating.
This is a classic capitulation signal. The weak hands are gone. The people still holding (and buying) at $70K are the ones who believe in the long-term thesis. When exchange supply gets this low, it creates a supply squeeze that can amplify the next rally.
ETF Flow Data: Following the Institutional Money
One of the biggest differences between this correction and previous ones? Spot Bitcoin ETFs exist now. And their flow data tells you exactly what institutional money is doing.
During the sharpest part of the selloff (January-February 2026), ETF outflows hit multi-week streaks. Institutions were de-risking. But in the last few weeks, we've seen the pattern shift. Inflows are returning on individual days, and the cumulative outflow trend is flattening. This doesn't mean the bottom is in, but it does mean the institutional panic is cooling.
Keep an eye on daily ETF net flow data. Three to five consecutive days of positive inflows, especially during price weakness, is one of the strongest signals that big money is re-entering the Paddle Zone. If you want to understand how ETFs are reshaping the crypto landscape more broadly, check out our deep dive on what the new altcoin ETFs mean for traders.
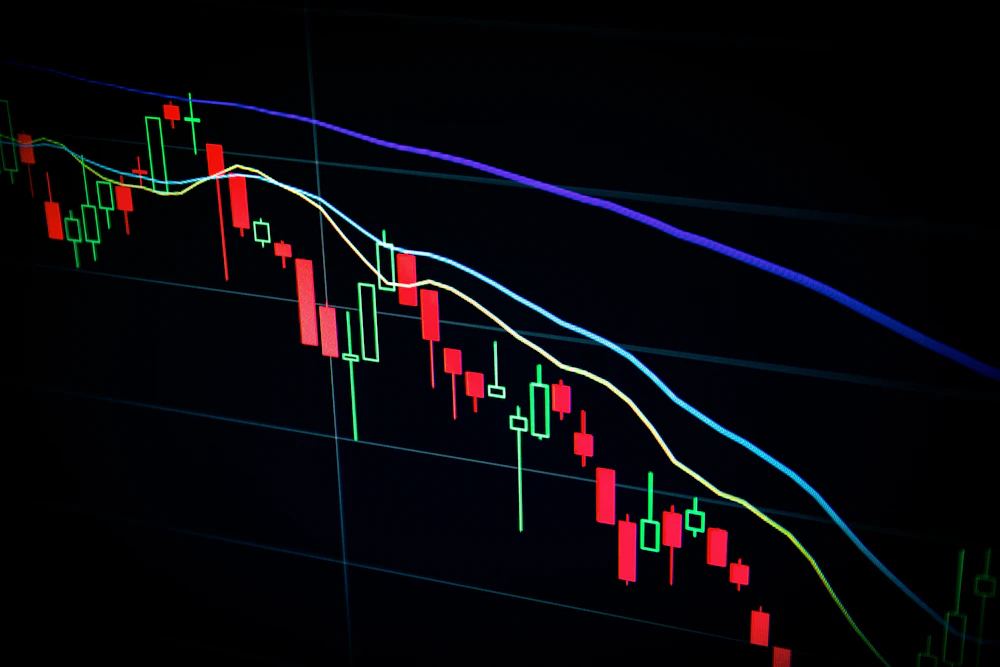 Image Source: Unsplash
Other On-Chain Signals to Watch
MVRV Z-Score
When this drops below 0, it historically marks generational buying opportunities. We're approaching that zone.
Miner Capitulation
Hash rate dips followed by rapid recovery signal that the weakest miners have left. The strong survivors start accumulating.
Stablecoin Reserves on Exchanges
Rising stablecoin balances on exchanges mean buyers are staging capital, ready to deploy. Think of it as surfers waxing their boards on the beach. They're getting ready for something.
Strategy 3: Managing Your Positions Through the Wipeout Zone
Buying the dip gets all the attention, but honestly? Managing what you already own is more important during a correction. There's no point accumulating new positions if your existing ones are bleeding without a plan.
Set Stop Losses Before You Need Them
If you don't have stop losses in place right now, set them today. Not tomorrow. Not "when the market calms down." Today. A stop loss is your lifeguard. You don't wait until you're drowning to call for one.
For BTC positions opened near current levels, a reasonable stop might sit at 10-15% below your entry. For altcoin positions, wider stops (20-25%) may be necessary given their higher volatility. The key is having them defined before emotion takes over.
Wipeout Zone
In WaveTrader, the Wipeout Zone marks the price level where your risk tolerance says "get out." It's the red zone on your chart where continuing to hold crosses from conviction into hope. The WaveTrader app visualizes these zones directly on your charts, so you can see at a glance whether you're in a comfortable Paddle Zone or dangerously close to wiping out.
Right-Size Your Exposure
Here's a question most traders avoid: can you sleep at night with your current position sizes? If the answer is no, your positions are too large. Corrections have a way of exposing over-leveraged portfolios.
A simple rule: no single position should represent more than 5-10% of your total portfolio unless it's BTC or ETH. If you're holding a bag of altcoins that's keeping you up at night, trimming to a size you can hold through more pain is the right move. You can always add back later from a position of strength rather than stress.
Define Your "If/Then" Exit Plan
Every position needs a pre-defined exit plan with two scenarios:
If It Recovers
"I'll take 25% profit at $X and trail my stop on the rest." Define your up-swell targets now, when your head is clear.
If It Drops Further
"My stop is at $Y, and if it hits, I close the position and wait." Know your Wipeout Zone before you're in it.
Writing your plan down makes it real. Keeping it in your head makes it negotiable when the market tests your resolve at 2 AM.
The Psychology Game: Your Biggest Edge or Enemy
The data says corrections are normal. The strategies are straightforward. So why do most traders still blow up during drawdowns? Because trading a correction isn't really about trading. It's about managing yourself.
The Revenge Trading Trap
You took a loss. It stings. So you jump back in, bigger this time, trying to make it back in one trade. This is revenge trading, and it kills more crypto portfolios than any bear market ever has.
Revenge trading is like paddling back out into the impact zone right after getting slammed by a wave. You're tired, emotional, and making decisions from ego instead of analysis. The ocean (and the market) doesn't care about your feelings. It will humble you again if you come at it angry.
The fix? After every meaningful loss, take a mandatory 24-hour break from trading. No charts, no Twitter, no "just one quick trade." Let the emotional wave pass before you paddle back out.
Panic Selling: Locking in the Pain
When the Fear & Greed Index hits 5, the dominant impulse is to sell everything and run. The numbers show this is almost always the worst possible response. Historically, selling when the index is in single digits has meant selling within a few percentage points of the bottom.
Panic selling turns a paper loss into a permanent one. If you've already defined your stop losses (see Strategy 3 above), you don't need to panic. Your plan handles the downside automatically. If the stop hasn't triggered, your position is still within your risk tolerance. Breathe.
Let the Data Talk, Not the Noise
During volatile sessions, it helps enormously to have something that cuts through the emotional noise with objective analysis. This is where tools like Kai, WaveTrader's AI surf analyst, become genuinely valuable. Instead of doom-scrolling Twitter for opinions, you can ask Kai for a data-driven read on current conditions: where are the support levels, what are the Break Signals saying, and what does the volume profile look like? Getting calm, factual answers during a meltdown is worth more than any trading strategy.
🏄 Pro Surfer Tip
The best surfers study wave patterns before every session. They don't paddle out blind and hope for the best. Before you open your trading app each morning, spend five minutes reviewing the data, not the headlines. Your frame of mind at market open determines the quality of every decision you'll make that day.
When the Swell Returns: Positioning for Recovery
Corrections end. Every single one in Bitcoin's history has ended. The question isn't whether the swell returns, it's whether you'll be positioned to catch it when it does.
 Image Source: Unsplash
Recovery Signals to Watch For
Fear & Greed Climbing Above 25
The shift from Extreme Fear to regular Fear is usually the first sign the tide is turning.
BTC Reclaims the 200-Day Moving Average
This has historically marked the start of new uptrends. It's the moment the Up Swell starts building.
3-5 Consecutive Days of ETF Inflows
A sustained inflow streak means institutional money has stopped running and started buying.
Altcoins Start Outperforming BTC
When risk appetite returns, capital flows from BTC into alts. This "altseason" rotation is a classic late-recovery signal.
Funding Rates Flip Positive on Perpetual Futures
This shows that leveraged traders are betting long again, rebuilding the bullish consensus.
How to Size Back In
If you trimmed positions during the correction (smart move), don't jump back to full size all at once when recovery signals appear. Scale in just like you scaled out: gradually, with defined price levels, and always with stop losses below your entries.
A good framework: re-enter with 25% of your target position size when you see the first cluster of recovery signals. Add another 25% when BTC clears a major resistance level. Keep the remaining 50% for confirmation of a sustained uptrend. This tiered approach lets you participate in the early recovery without being fully committed to what could still be a bear market rally (a "dead cat bounce," or in surf terms, a rogue wave before the real swell arrives).
WaveTrader's Break Signals can help you spot these inflection points in real time. When a Break Signal fires on the daily chart after weeks of consolidation, that's your cue that something meaningful is shifting. It's the equivalent of seeing the horizon darken with an incoming set after a long flat spell.
The Bigger Picture
If Bitcoin's history teaches anything, it's that the traders who survive corrections and stay positioned are the ones who profit most from the recovery. The people who sold BTC at $3,200 in 2018 missed the run to $69,000. The people who panic-sold at $15,500 in 2022 missed the climb to $126,000.
This correction will feel like ancient history in a year or two. The question is what you do right now: will you be the trader who panicked and sold the bottom, or the one who followed a plan, accumulated the Paddle Zone, and was ready when the biggest swell of the cycle arrived?
"The ocean rewards those who respect its power and prepare for its patterns. The market is no different."
If you want a solid foundation to build on for what comes next, our guide to building a crypto portfolio that actually makes money covers the structural thinking behind positioning for the long term.