Quick Answer
Most traders pick wrong entry points because they chase breakouts driven by FOMO, enter during low-liquidity periods, and ignore institutional timing patterns. The fix: trade only during institutional "killzones" (8:00-11:00 AM EST for US markets), wait for breakout-retest confirmation with volume, and align your entries with smart money flow instead of fighting the current.

The stock market ocean churns with opportunity, yet 90% of retail traders crash against the rocks because they paddle in too early, chasing price waves without reading the deeper currents. You've felt this sting before—watching a stock rocket skyward moments after you bailed out, or seeing it nosedive right after you jumped in. This isn't bad luck. It's a timing problem that wipes out more accounts than any other mistake.
Fear and greed act like rip currents in your trading psychology, pulling you into positions at exactly the wrong moment. Those twin emotions make you chase breakouts that fizzle and bail on setups just before they work. Finding the sweet spot for your stock market entry point demands more than chart patterns—it requires reading the institutional waves that actually move prices. Most traders drown because they rely on single indicators, ignore market context, and surf without proper risk management.
The pattern repeats endlessly: new traders make the same subtle mistakes, especially misjudging how much they're really risking. Can't explain why you're in a trade? Don't know when you'll exit? Have no clue how much you stand to lose? You're paddling blind in shark-infested waters. The result? Retail traders consistently buy high and sell low—the perfect recipe for account destruction.
Here's the good news: you can learn to read market waves like seasoned pros do. Seasoned traders don't rely on luck; they read the waves. This guide shows you why most traders time their entries wrong and how to build a structured approach that rides alongside institutional flow instead of fighting the current.
🔑 Key Takeaways
- Psychology sinks more accounts than bad analysis: FOMO, impatience, and revenge trading cause most early entries
- Trade during killzones only: London (2:00-5:00 AM EST), New York (8:00-11:00 AM EST), and Asian (7:00-9:00 PM EST) sessions offer the best institutional flow
- Wait for breakout-retest confirmation: Strong volume on breakout + low volume on retest = high-probability entry
- Institutions sweep liquidity first: They trigger retail stops before the real move begins—don't be the liquidity
- Use visual tools for clarity: WaveTrader transforms complex data into readable wave patterns for better timing
Why Most Traders Get Entry Timing Wrong
The biggest problem isn't your chart reading skills—it's your head. Psychology sinks more trading accounts than bad analysis ever will. Most traders know what to look for but can't resist the emotional undertows that pull them into trades at exactly the wrong moment.
FOMO and the fear of missing the move
Fear Of Missing Out hits like a rogue wave, sweeping away your best-laid plans in seconds. This emotional pressure tricks you into believing every breakout is the last train to profit town, making you abandon tested strategies for panic buying. News events and sudden price spikes trigger the strongest FOMO attacks, sending traders scrambling into positions just as institutions prepare to reverse the move.
Here's how the trap snaps shut: gold breaks above $2,650.00 and you immediately jump in, certain this signals a major trend. But that breakout? It's actually a liquidity sweep designed to collect your stop-losses before price crashes back to $2,640.00, taking you out at the worst possible moment. Meanwhile, institutional traders sit patiently on the sidelines, waiting for the retest to confirm their entry. They profit from your impulsive decision.
FOMO (Fear Of Missing Out)
An emotional trigger that causes traders to enter positions impulsively when they see price moving without them. FOMO leads to chasing breakouts, abandoning trading plans, and buying at market tops—like paddling desperately after a wave that's already passed you by.
Impatience during low-volume sessions
Patience separates winning traders from the rest, yet impatience destroys more accounts than any other single factor. During quiet periods like the late Asian session, antsy traders force setups that aren't there, mistaking sideways drift for opportunity. The market tests your patience precisely when you most want action.
The irony runs deeper than you might expect. Major trends often emerge from boring consolidation periods that frustrate everyone watching. These sideways zones form after big moves, creating a series of failed breakout attempts that get weaker with each try. Volume drops as traders give up and walk away. This is exactly when the real move begins—when nobody expects it anymore. Understanding wave patterns and corrections helps you recognize these consolidation phases for what they really are.
Misreading price action without context
Single candles lie. Retail traders fall for this trap constantly, buying bullish patterns on short timeframes without checking what the bigger picture shows. That green hammer on your 15-minute chart might look like a reversal signal, but if it's sitting right below major daily resistance, you're walking into a liquidity sweep that will steamroll your position.
Volume tells the real story that price alone can't reveal. A breakout with heavy volume that pulls back on light volume? That's healthy price action worth watching. But when charts get messy and signals conflict, the smart money stays out. "If the market isn't giving clean resolution, it's not worth the risk."
Lack of a structured timing system
Random entries produce random results. Without a timing framework, you're essentially throwing darts at a board in the dark. Most traders enter whenever they feel like it, creating inconsistent performance that erodes confidence over time. Institutions don't trade this way—they operate within specific windows where liquidity and volatility align for optimal conditions.
WaveTrader addresses this exact problem by turning complex market data into visual wave patterns you can actually read. Instead of guessing when to paddle out, you see the institutional timing windows as clear as morning swells. The market moves in predictable cycles of liquidity and volume that repeat daily, and once you recognize these patterns, finding quality entry points becomes much clearer.
The Psychology Behind Early Entries
Your mind works against you in the markets more than any technical indicator ever will. Studies prove that psychological discipline beats chart-reading skills every time, yet most traders focus on patterns while ignoring the mental storms brewing inside their heads. The real enemy isn't market volatility—it's the emotional undertow that drags you into trades at exactly the wrong moment. If you've ever experienced revenge trading, you know exactly how destructive these emotional triggers can be.
Cognitive biases that drive poor decisions
Your brain evolved to keep you alive on the savanna, not to trade financial markets. Those helpful mental shortcuts that once saved your ancestors now sink your trading account. Loss aversion hits hardest—research shows you fear losses about twice as much as you value equivalent gains. This explains why you hesitate to catch a perfect wave but refuse to exit when the tide turns against you.
Confirmation Bias
You cherry-pick information supporting your trade idea while ignoring warning signals.
Recency Bias
Yesterday's big move convinces you it'll continue tomorrow—but markets rarely repeat exactly.
Anchoring Bias
You cling to your entry price like a life raft ("I'll only sell when it gets back to even").
These biases create a vicious cycle. Fear makes you bail on winning trades early, then greed kicks in and you chase the move after it's already happened.
Emotional triggers: fear, greed, and revenge
Market conditions trigger emotional responses as predictable as ocean tides. Sharp drops spark panic selling. Sudden spikes breed FOMO buying. Sideways chop makes you impatient. Even breaking even triggers relief-selling when you should stay in the water.
Greed shows up as holding trades too long, sizing up after wins, and ignoring stop-losses when everything looks rosy. Fear does the opposite—making you hesitate on solid setups, exit winners early, and obsess over worst-case scenarios.
The most destructive emotion? Revenge trading. One trader lost more in sixty minutes than he'd made in three months—a perfect example of how emotional storms can destroy months of careful progress in a single session.
Revenge Trading
The destructive behavior of immediately entering new trades after a loss, driven by the emotional need to "get back" at the market. Revenge traders increase position sizes, abandon risk management, and often turn small losses into account-crushing disasters—like paddling into bigger and bigger waves after a wipeout until you're too exhausted to make it back to shore.
The illusion of control in fast-moving markets
Fast markets make you feel powerful. Price moves quickly, your trades get filled instantly, and you start believing you can predict every wave. This illusion of control makes you overestimate your market-reading abilities. Soon you're overtrading, trying to control outcomes through constant action rather than patient positioning.
Overconfidence hits hardest after a few winners. You think you've cracked the market's code. Reality check: even professional fund managers with teams of analysts struggle to beat the market consistently.
WaveTrader's visual approach cuts through this psychological noise by turning abstract market data into clear wave patterns. When you see market structure as waves to ride rather than puzzles to solve, you gain the perspective needed to paddle out at the right time and wait on shore when conditions aren't right—helping you overcome the mental traps that lead to early entries.
How Institutions Time Their Entries
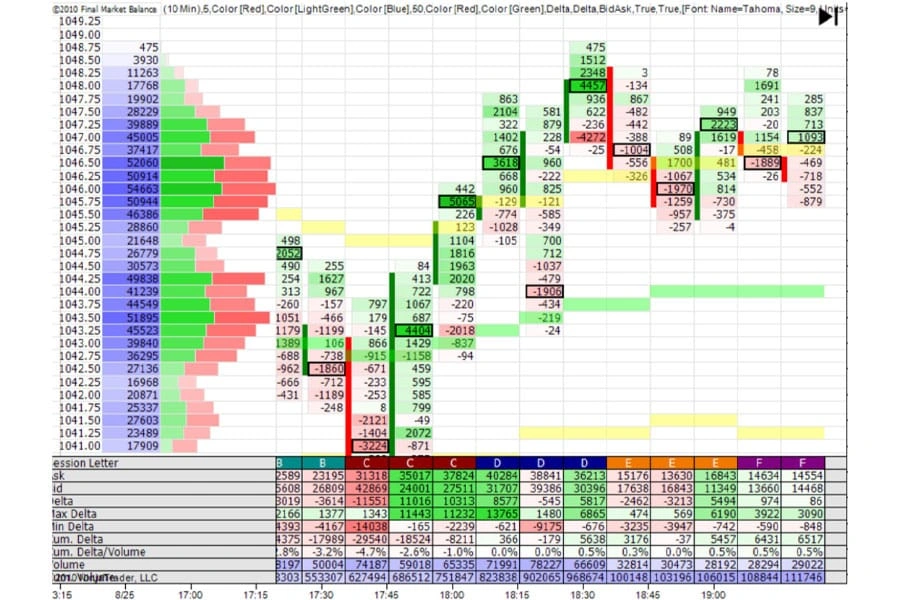 Image Source: Opofinance Blog
While retail traders paddle out frantically whenever they see a wave, institutions surf like pros—methodical, patient, and deadly accurate with their timing. Their calculated approach explains why most retail money ends up in institutional pockets.
Understanding killzones and liquidity windows
Think of killzones as the prime surf breaks where the biggest waves form. These aren't random time periods but specific windows when institutional money creates the volatility and liquidity needed for major moves. Smart money operates within these carefully chosen hours when conditions align perfectly:
London Killzone
2:00 - 5:00 AM EST
European desks wake up and start moving major pairs
New York Killzone
8:00 - 11:00 AM EST
USD pairs come alive with highest volume of the day
Asian Killzone
7:00 - 9:00 PM EST
JPY, AUD, NZD pairs see institutional activity
What makes these windows special? Higher volatility, massive trading volume, and tighter spreads create the perfect storm for institutional execution. These periods show predictable order flow patterns that create cleaner, more readable price action. WaveTrader's visual system highlights these institutional surf sessions, showing you exactly when the big players paddle out.
The role of liquidity sweeps and stop hunts
Here's where institutions get clever. They need to fill enormous orders without pushing prices against themselves. Solution? Engineer "liquidity sweeps" that create the volume they need for smooth entries.
A liquidity sweep unfolds differently than a quick grab. While simple grabs happen with sharp wicks, sweeps methodically work across multiple candles. Institutions target predictable areas where retail stops cluster—swing highs and lows, support and resistance zones, round numbers. Understanding break signals helps you recognize when these sweeps are occurring.
These sweeps often hit during quiet periods for maximum impact. Once the sweep clears out retail positions, price typically snaps back to the original range, leaving early retail entries underwater.
Liquidity Sweep
An institutional strategy where smart money deliberately pushes price into areas where retail stop-losses cluster, triggering those orders to create the volume needed for their own entries. Think of it as a big wave that clears out everyone who positioned too early before the real set arrives.
Why institutions wait for confirmation
Patience separates the pros from the amateurs. Institutions rarely chase—they follow a three-step process:
Engineer a liquidity sweep
Clear out retail stops to create volume for their entries
Wait for displacement
Confirm price moves decisively in their intended direction
Enter on the retest
Position into fair value gaps created during displacement
This disciplined approach focuses on trading within killzone windows rather than forcing random setups. Filtering entries by time and confirmation eliminates most bad trades while concentrating on high-probability opportunities.
WaveTrader's visual approach transforms these institutional patterns into readable wave formations. Instead of guessing when smart money moves, you'll see exactly when institutions are positioning—giving you the chance to ride their wake rather than getting crushed by their waves.
Fixing Your Entry Strategy with a Timing Framework
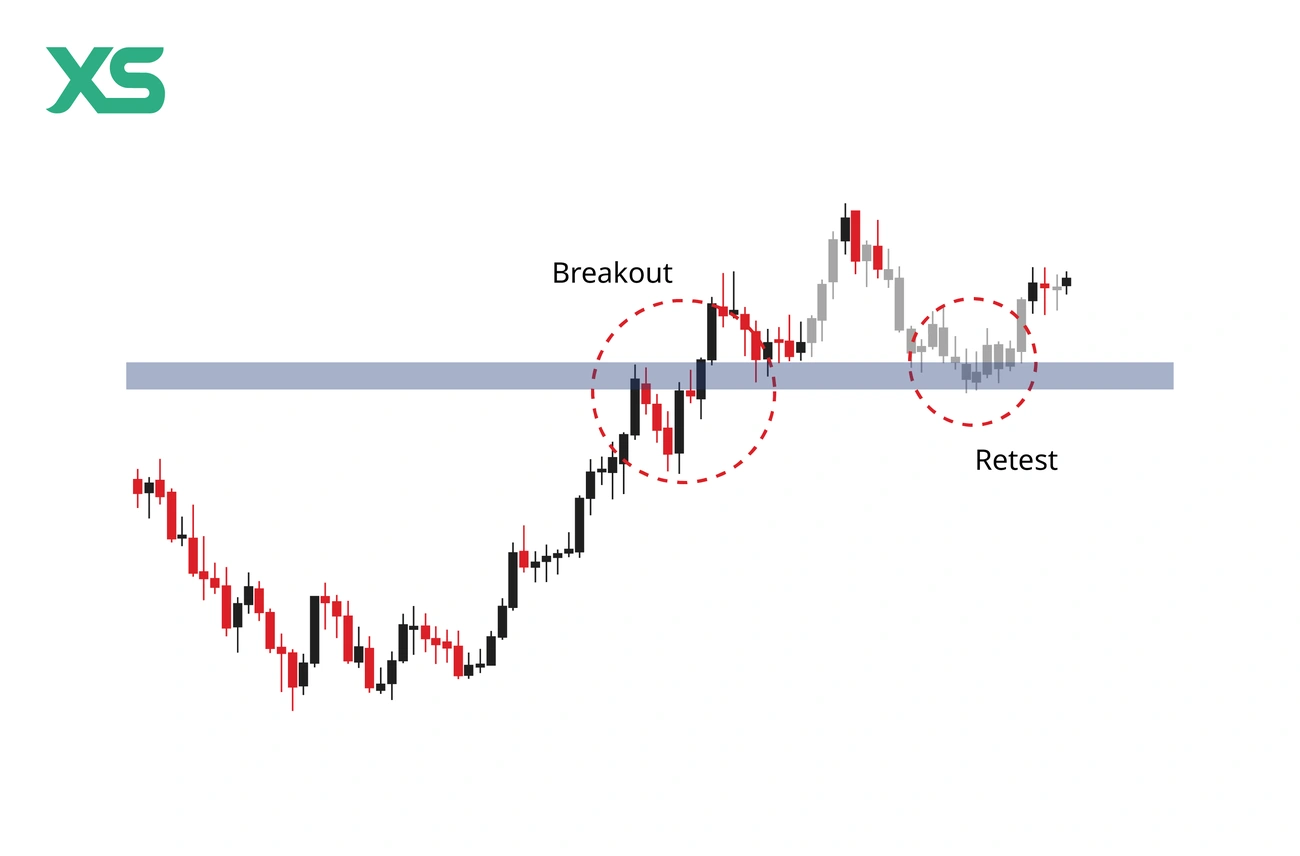 Image Source: XS
Building a solid timing framework changes everything about how you approach stock entry points. No more throwing darts at price charts or hoping for the best. This structured approach helps you spot the high-probability zones where institutions actually make their moves.
Using breakout-retest setups for confirmation
The breakout-retest setup ranks among the most reliable stock entry point strategies you can master. Here's how it works: price breaks through a key support or resistance level, then pulls back to "test" that same level before continuing its journey. Think of this retest as the market's way of double-checking—does this breakout have real legs or is it just a head fake?
Watch for these confirmation signals:
- ✅ Strong volume during the initial breakout
- ✅ Low volume during the retest (showing lack of selling pressure)
- ✅ Clear price action signals (engulfing candles, pin bars) at the retest level
The sweet spot hits when multiple signals align at these key levels with solid volume backing the move. For traders learning Fibonacci retracement levels, these retests often align with key Fibonacci zones, adding confluence to your entry.
Mapping key levels during the Asian session
Most traders dismiss the Asian session (7:00 PM–3:00 AM EST) as dead water. Big mistake. This quiet period actually sets up tomorrow's best waves. The Asian session defines the daily range that London and New York will later exploit. Smart money uses these calm hours to mark territory and build liquidity pools above and below the range.
Professional traders religiously track Asian session highs and lows, knowing London will almost certainly sweep one side. This "Asian Range Theory" reveals how institutions use the overnight hours to set their traps and accumulate positions for the next day's breakouts.
Aligning entries with institutional flow
Finding the best stock entry point daily means surfing alongside the big money instead of fighting the current. Institutions operate within specific timing windows where volatility and volume create perfect conditions. They follow a disciplined three-step process:
- Engineer liquidity sweeps to trigger retail stop-losses
- Wait for price displacement in their intended direction
- Enter when price retraces into value areas
Master traders combine top-down analysis—using higher timeframes for trend direction and lower timeframes for precise execution—to dramatically improve their entry accuracy. This approach aligns with the visual analytics techniques that make complex market data readable.
How WaveTrader helps visualize timing zones
WaveTrader cuts through the chart clutter by turning complex market data into clear wave patterns. Even newer traders can spot institutional timing windows when the data gets presented visually. The app reveals key support and resistance zones where price typically bounces, shows session-specific ranges, and highlights volatility patterns unique to each trading period. You'll quickly recognize:
- 🌊 Session breakout opportunities
- 🌊 Range-bound versus trending behavior
- 🌊 Key price levels institutional traders are watching
This visual approach helps you overcome those psychological impulses that lead to premature entries, keeping you aligned with institutional flow rather than swimming against the tide.
Common Entry Mistakes and How to Avoid Them
Even seasoned wave riders get caught in the undertow sometimes. Spotting these common entry traps before they drag you down can save your stock entry point strategy from turning into expensive lessons.
Chasing breakouts without volume confirmation
Volume separates real breakouts from fakeouts every single time. Authentic breakouts surge with heavy volume, proving institutional money is actually behind the move. Without this confirmation, you're surfing foam instead of waves.
WaveTrader's visual approach cuts through the noise, showing you instantly when breakouts have real institutional backing versus retail-driven head fakes that collapse within hours.
Fakeout
A false breakout where price briefly moves beyond a key level before reversing sharply. Fakeouts trap traders who chase initial moves without waiting for confirmation. They're especially common at obvious support/resistance levels where retail stops cluster—like a wave that looks big but breaks before you can ride it.
Entering during low-liquidity periods
Thin liquidity turns the market into a kiddie pool where every splash creates massive waves. Small orders can shove prices several ticks in either direction. These danger zones hit during lunch hours, final trading sessions, and holiday periods when the big players head to shore.
Low liquidity creates unstable prices where manipulation runs wild and single large orders create disproportionate moves. It's like trying to surf during a hurricane—the risk rarely matches the reward.
Ignoring higher timeframe structure
That beautiful breakout on your 5-minute chart? It might be nothing more than a ripple on the daily timeframe. This mismatch between timeframes creates choppy trades that stop you out before the real move begins.
Support and resistance levels from higher timeframes carry more weight. They provide the directional context that separates confident entries from coin flips. As we discussed in our beginner's guide to market analysis, always check the bigger picture before committing.
Overleveraging and poor stop placement
Overleveraging happens when you borrow more than you can handle losing. This amplifies every emotion, turning small setbacks into account-crushing disasters. Smart money risks 1-2% per trade maximum, placing stops where the trade thesis actually breaks down—not at random psychological levels.
When choosing which exchange to use, consider their leverage options carefully. Higher leverage isn't always better—it's often the fastest path to a blown account.
Using indicators without context
Many traders stack indicators that tell the same story, creating false confidence through redundant signals. Others rely on single indicators while ignoring the broader market tide. No single tool captures the full picture.
WaveTrader solves this by turning complex data into visual wave patterns, giving you context for every signal before you paddle in.
⚠️ Quick Reference: 5 Entry Mistakes to Avoid
🤔 Frequently Asked Questions
What is the best time to enter a stock trade?
The best entry times align with institutional "killzones"—specific windows when smart money creates volatility and liquidity. For US markets, the New York Killzone (8:00-11:00 AM EST) offers the highest probability setups. Wait for breakout-retest confirmations with strong volume rather than chasing initial breakouts.
Why do I always enter trades at the wrong time?
Most traders enter at the wrong time due to psychological triggers like FOMO (Fear Of Missing Out), impatience during quiet sessions, and emotional reactions to price movements. Institutions exploit these behaviors through liquidity sweeps that trigger retail stop-losses before the real move begins.
What is a breakout-retest entry strategy?
A breakout-retest strategy waits for price to break a key level, then pulls back to "test" that level before continuing. This confirmation step filters out fake breakouts. Look for strong volume on the initial breakout, low volume on the retest, and clear price action signals like engulfing candles at the retest level.
How do institutional traders time their entries?
Institutions follow a three-step process: 1) Engineer liquidity sweeps to clear retail stops, 2) Wait for price displacement in their intended direction, 3) Enter when price retraces into fair value gaps. They operate within specific killzone windows and never chase breakouts without confirmation.
How can I avoid FOMO when trading?
Combat FOMO by having a structured timing framework before market opens, trading only during institutional killzones, waiting for breakout-retest confirmation instead of chasing initial moves, and using visual tools like WaveTrader to see market structure clearly. Remember: missing a trade is free, but a bad entry costs money.
Catch Every Swell With Confidence
Your trading account doesn't have to be another casualty of bad timing. The difference between profitable traders and the 90% who lose money comes down to one thing: knowing when to paddle in and when to wait on shore.
The patterns are clear now. FOMO makes you chase waves that crash before you can ride them. Impatience pulls you into choppy water during low-volume sessions. Fear keeps you on the beach when perfect swells roll through institutional killzones. But once you see these psychological traps for what they are, you can start surfing around them instead of getting pummeled.
The market ocean moves in predictable rhythms—London killzones, New York sessions, Asian range setups that institutional traders exploit daily. Master the breakout-retest pattern and you've got a reliable way to confirm whether a wave has real power behind it. Map those Asian session levels and you'll know exactly where the smart money plans to sweep retail stops.
Volume tells the real story. Without it backing your breakout, you're riding foam instead of a genuine swell. Higher timeframes show you the bigger picture—what looks like a perfect entry on your 5-minute chart might be nothing more than chop on the daily.
Most importantly, stop forcing trades when the conditions aren't right. The ocean doesn't care about your schedule, and neither do institutional traders. Wait for your spots. Ride the waves that have real momentum behind them.
WaveTrader turns this complex timing game into something you can see and feel. When market data becomes visual waves instead of confusing charts, timing your entries feels as natural as reading the surf report before dawn patrol.
The best part? You don't need to become a market wizard overnight. Start small. Focus on one or two high-probability setups. Let the waves come to you instead of chasing every ripple on the surface.
Ready to stop getting tumbled by the market and start riding alongside the pros? The next perfect swell is already building—you just need to know where to look.
Disclaimer: This article is for educational and informational purposes only. It does not constitute financial, investment, or trading advice. Cryptocurrency markets are volatile and carry significant risk. Past performance does not guarantee future results. Always do your own research and consider consulting a qualified financial advisor before making any investment decisions.