Quick Answer
This swing trading pattern generated $50K by combining three indicators: RSI crossing above 50, MACD showing bullish crossover, and price breaking resistance with increasing volume. The setup works on 4-hour to daily timeframes, holding positions 5-14 days to capture 10-30% moves in Bitcoin and major cryptocurrencies. Success requires staged exits, strict stop-losses, and waiting for multiple confirmations before entry.
The crypto markets never sleep—and neither do the opportunities. While day traders chase every ripple and long-term holders wait for distant shores, swing traders ride the perfect waves in between. These are the swells that build over days, not hours, giving you time to paddle into position before the real momentum hits.
Most traders get crushed trying to catch every market move. They either burn out from the constant screen time of day trading or miss the big moves waiting years for their "hodl" strategy to pay off. But what if there was a middle path? A way to catch substantial price swings without gluing yourself to charts 24/7?
That's exactly what happened when I discovered a specific pattern that generated $50K from a single Bitcoin swing trade. The setup wasn't complex—it combined three simple indicators that most traders know but rarely use together. More importantly, it worked during both bull and bear market conditions.
The breakthrough came after months of watching Bitcoin's price dance around the same levels. While other traders saw choppy, sideways movement, I started noticing a rhythm beneath the surface chaos. Like spotting the perfect set wave before other surfers, timing became everything.
🔑 Key Takeaways
- Three-indicator confluence: RSI above 50, MACD bullish crossover, and volume confirmation create high-probability setups
- Optimal timeframes: 4-hour charts for entry timing, daily charts for trend confirmation, trades lasting 5-14 days
- Staged exits: Take 30% at first target, 40% at second, ride final 30% to major resistance
- Risk management: Never risk more than 1-2% per trade, use stop-losses below support levels
- Asset selection: Focus on Bitcoin and Ethereum for reliable patterns and sufficient liquidity
What is Swing Trading in Crypto?
Think of swing trading as catching the perfect wave—not the tiny ripples day traders chase or the massive swells that take years to build. You're looking for those medium-sized moves that develop over days or weeks, giving you time to position yourself before the momentum really kicks in.
Swing traders hold positions anywhere from a few days to several weeks. Rather than trying to profit from every minor price twitch, you're hunting bigger fish—the 10-30% moves that crypto markets serve up regularly. The sweet spot sits on 4-hour to daily timeframes, where real patterns emerge from the market noise. For beginners learning how to start cryptocurrency trading, swing trading offers a balanced approach between intense day trading and passive holding.
Swing Trading
A trading style that aims to capture price moves over several days to weeks, focusing on medium-term trends. Unlike day trading (which closes all positions daily) or position trading (which holds for months), swing trading balances active participation with manageable time commitment—like catching waves that give you time to paddle into position.
How Swing Trading Differs from Day Trading
Day trading feels like sprinting through a minefield. Every position must close before the trading session ends, cramming all your decisions into a few intense hours. The time pressure creates stress, demands constant screen watching, and turns trading into a full-time job that most people simply can't sustain.
Swing trading flips the script entirely. Here's what changes:
- 🌊 Hold positions for days or weeks, not hours
- 🌊 Spend 1-2 hours daily on analysis versus 6-8 hours for day trading
- 🌊 Experience significantly less stress from reduced time pressure
- 🌊 Pay fewer trading fees due to less frequent transactions
Day traders become prisoners of their charts, making split-second decisions under pressure. Swing trading lets you keep your day job while still participating actively in crypto markets. You can set your positions, place stop-losses, and let the market work for you without constant supervision.
Why Swing Trading Suits Volatile Markets Like Crypto
Crypto markets never close, and they move fast—sometimes 10-20% in a single day. This volatility terrifies some traders but creates perfect conditions for swing strategies.
Bitcoin and Ethereum regularly deliver 10-30% moves within days, offering profit potential that traditional markets rarely match. These substantial swings happen frequently enough to provide consistent opportunities, yet develop slowly enough that you don't need constant monitoring. Understanding crypto trading analytics helps identify these opportunities before they fully develop.
Crypto markets also show clear technical patterns during quiet periods before explosive directional moves. It's like watching storm clouds gather on the horizon—experienced traders can position themselves before the weather hits.
WaveTrader makes reading these patterns intuitive for beginners. Green "Paddle Zones" highlight potential entry points, while red "Wipeout Zones" warn when it's time to exit. The app shows momentum as blue "Up Swell" and orange "Down Crash" waves, turning complex chart analysis into something as readable as checking a surf report.
The $50K Pattern: My Personal Crypto Swing Trade
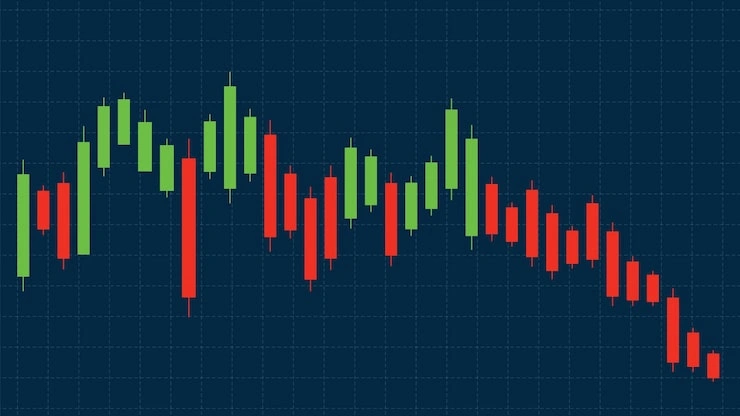 Image Source: Freepik
Three months of sideways Bitcoin price action nearly drove me insane. Every day, the same dance: pump to $45K, dump to $42K, rinse and repeat. Most traders had given up, convinced the market was dead in the water. But I kept watching, kept studying, because sometimes the best swells come after the longest calm.
How I Discovered the Pattern
The breakthrough happened on a Tuesday morning while reviewing my fourth cup of coffee and another seemingly identical chart. Bitcoin had been trapped in this range for weeks, but something felt different. The selling pressure seemed exhausted—like waves that keep hitting the shore but each one a little weaker than the last.
That's when I noticed the pattern hiding in plain sight. During these consolidation phases, Bitcoin wasn't just moving sideways randomly. The price was coiling, building energy like water being pulled back before a massive wave. Three specific indicators were quietly aligning beneath the surface noise, creating a setup most traders missed entirely.
The pattern required patience—something day traders never develop. While they chased every 2% wiggle, I was tracking momentum shifts that played out over days, not hours. My backtesting revealed the sweet spot: 4-hour charts for timing, daily charts for confirmation. Trades lasting 5-14 days caught the biggest swells.
Consolidation Pattern
A period when price moves sideways in a tight range, with neither buyers nor sellers gaining control. This compression builds energy for the next big move—like water being pulled back before a wave crashes forward. The longer the consolidation, the more explosive the eventual breakout.
The Coin I Traded and Why
Bitcoin was the obvious choice, but not for the reasons you might think. Sure, it had the liquidity to enter and exit without slippage issues. But the real magic was Bitcoin's respect for technical levels—it actually listened to support and resistance like an obedient student.
Smaller altcoins might promise bigger percentage gains, but they're like surfing in a hurricane. Bitcoin moves with purpose, following predictable patterns that have held true across multiple market cycles. When Bitcoin consolidates for weeks then breaks out, it typically means business. Choosing between the lowest fee crypto exchanges can also impact your profitability on these swing trades.
The WaveTrader app confirmed what my eyes were already seeing. While the price chart showed boring sideways movement, the app's "Up Swell" visualization was building momentum beneath the surface. Blue waves were intensifying even as the dollar price stayed flat—a clear sign that pressure was mounting for an explosive move higher.
Timeline and Trade Setup
After three weeks of consolidation, the setup finally triggered. Bitcoin had been testing the $44,500 resistance level repeatedly, each attempt weaker than the last. Then volume started creeping higher while the price stayed contained—a textbook compression pattern.
My entry came when Bitcoin finally cracked above its 50-day moving average with conviction. But I didn't just jump in blind:
The Confluence Zone:
- ✓ RSI crossed above 50 for the first time in weeks
- ✓ MACD flipped bullish with increasing momentum
- ✓ On-Balance Volume trending up despite flat prices—smart money accumulating
- ✓ WaveTrader flashed its green "Paddle Zone" signal
This wasn't a gamble. Every indicator pointed toward the same outcome: a breakout was coming, and it was going to be substantial. Based on Bitcoin's historical patterns after similar compression phases, I expected 15-25% gains within two weeks. Understanding profitable chart patterns helped me recognize this setup.
Profit Breakdown and Exit Strategy
Greed kills more traders than fear ever will. Instead of betting everything on a single exit price, I planned multiple escape routes like a surfer who knows exactly when to kick out of a wave.
The staged exit kept me disciplined:
First Wave (30% position):
Sold at 12% gain when Bitcoin hit initial resistance
Second Wave (40% position):
Exited at 20% gain as momentum peaked
Final Wave (30% position):
Held until WaveTrader's red "Wipeout Zone" appeared near major resistance
Each sale moved my stop-loss higher, eventually creating a risk-free trade. The beauty of this approach? I captured an average 22% gain across my entire position, turning a calculated risk into $50K profit.
The WaveTrader app earned its keep during the exit phase. Just as the price approached a major resistance level, the red "Wipeout Zone" alert flashed—perfect timing to close my final position before the inevitable pullback.
Breaking Down the Pattern: What Made It Work
The $50K trade wasn't luck—it was pattern recognition. Like learning to read weather before a surf session, I had to decode what Bitcoin was actually telling me beneath all the market noise. Three specific elements aligned to create this high-probability setup, and understanding them could save you months of trial-and-error learning.
Key Price Action Signals
Price action strips away everything except what matters most: where buyers and sellers are actually fighting. While indicators can lie or lag, price movements reveal the truth about market sentiment in real time.
The breakthrough signal appeared as momentum candles—those sharp moves that reject key levels with conviction. Picture this: Bitcoin would approach a resistance level, get smacked down hard, then immediately bounce back stronger. These weren't gentle tests; they were aggressive rejections followed by equally aggressive recoveries.
What caught my attention were the hammer patterns forming at support levels. Each hammer showed Bitcoin's price getting slammed lower, only to close near the highs of that same period. Sellers were throwing everything they had at the market, but buyers kept stepping in at the same levels.
Hammer Candlestick
A bullish reversal pattern showing a long lower wick (shadow) with a small body at the top. It indicates sellers pushed price down significantly, but buyers stepped in to push it back up before close. Like a wave that crashes down but immediately rebounds—showing buyer strength at support levels.
Volume and Momentum Confirmation
Price tells you what happened. Volume tells you who cares.
During Bitcoin's consolidation, I watched for something specific: were the upward moves getting stronger support than the downward ones? The answer came through volume analysis. Every time Bitcoin pushed higher, trading volume increased—real buying interest, not just technical bounces.
The warning signs were absent too. When prices rise on declining volume, smart money is usually heading for the exits. But my setup showed the opposite pattern: higher prices accompanied by higher volume, confirming genuine accumulation. This is similar to identifying break signals that indicate momentum shifts.
The clincher was momentum alignment. I tracked how much "effort" (volume) was required to produce each price movement. The pattern revealed a sequence: initial selling pressure, absorption by buyers, testing of resolve, and finally—synchronization between effort and result. When volume and price momentum aligned, the breakout became inevitable.
Support and Resistance Zones
Most traders draw lines on charts and call them support or resistance. Real support and resistance zones are psychological battlegrounds where serious money makes decisions.
Support marks the price level where buying interest overwhelms selling pressure—where Bitcoin refuses to fall further. Resistance is the opposite: where selling pressure consistently stops upward movement. But not all levels are created equal.
My trade succeeded because I focused on the strongest zones—those tested multiple times without breaking. Here's what made them powerful:
- 🎯 Multiple tests: The more times a level holds, the more significant it becomes
- 🎯 Dramatic reversals: Sharp bounces from these levels show strong conviction
- 🎯 Time spent: Consolidation at key levels builds conviction among market participants
The multi-timeframe approach was crucial: weekly charts for major zones, daily for refinement, 4-hour for precise entry timing. This created a complete roadmap showing exactly where Bitcoin might pause, reverse, or accelerate.
Tools and Indicators I Used
 Image Source: blog.bitunix.com
Seasoned traders don't rely on luck; they read the waves. My $50K pattern success came from combining six specific indicators that work together like instruments in a surf forecasting station. Each tool served a purpose—some measured wave height, others tracked the tide, and a few predicted when the next set would roll in.
1. RSI (Relative Strength Index)
RSI (Relative Strength Index)
A momentum oscillator measuring buying versus selling pressure on a 0-100 scale, helping spot when markets might reverse direction. Below 30 indicates oversold conditions (potential buying opportunity), above 70 suggests overbought (potential selling opportunity). Like checking wave height before paddling out.
Think of RSI as your momentum gauge. When it drops below 30, sellers are getting exhausted—like surfers who've been paddling against the current too long. Above 70? The buying frenzy might be overdone, signaling a potential pullback ahead.
The magic happened when RSI crossed these threshold levels. RSI climbing back above 30 after a dip often marked the start of fresh upward momentum. But I never traded RSI signals alone—the strongest setups appeared when RSI diverged from price action, revealing hidden momentum shifts before they showed up on the price chart.
2. MACD (Moving Average Convergence Divergence)
MACD (Moving Average Convergence Divergence)
Three-part indicator showing the relationship between two moving averages—the MACD line, signal line, and histogram—to identify momentum changes. When the MACD line crosses above the signal line, it suggests bullish momentum. The histogram shows the strength of that momentum.
MACD became my momentum confirmation compass. Its three components work like a surf report: the MACD line (12-period EMA minus 26-period EMA), signal line (9-period EMA of MACD), and histogram showing their difference.
I watched for three specific MACD signals:
- 📊 MACD line crossing above signal line (bullish paddle signal)
- 📊 MACD line crossing above zero (strong swell building)
- 📊 Histogram bars growing taller (momentum accelerating)
3. Moving Averages (EMA/SMA)
Like the shoreline, moving averages smooth out short-term chop to reveal the market's true shape. I favored Exponential Moving Averages (EMA) over Simple Moving Averages (SMA) because they react faster to crypto's rapid price changes.
The golden setup: watching 12-period EMA cross above 26-period EMA with strong volume confirmation. These crossovers often preceded significant moves. Moving averages also acted as dynamic support and resistance—when price bounced off these levels with heavy volume, it created high-probability entry points.
4. Fibonacci Retracement
Fibonacci Retracement
Horizontal lines indicating potential support and resistance levels based on key percentages (23.6%, 38.2%, 50%, 61.8%, 78.6%) derived from the Fibonacci sequence. These levels often mark where price pullbacks pause before continuing the trend—like natural rest points on a long paddle out.
Fibonacci levels work like invisible barriers where waves often pause or reverse. The key levels—23.6%, 38.2%, 50%, 61.8%, and 78.6%—act as magnetic price points. Learning how to use Fibonacci retracement levels can significantly improve your entry timing.
The 61.8% level (the "golden ratio") provided the strongest signals. During uptrends, this level frequently offered perfect pullback entry points. Rather than blindly trusting these levels, I sought confluence—spots where Fibonacci aligned with RSI, MACD, and moving averages.
5. Volume Analysis
Volume tells you whether the market really means what it's showing. Strong volume behind price increases confirmed genuine buying interest and trend continuation. Price rises on weak volume? Often signaled false breakouts and potential reversals.
On-Balance Volume (OBV) became my accumulation detector. When OBV climbed while price moved sideways, it revealed smart money quietly building positions—a powerful signal before major breakouts.
6. WaveTrader App for Visual Analysis
WaveTrader turned complex chart analysis into visual surf forecasting. Green "Paddle Zones" highlighted optimal entry points, while red "Wipeout Zones" warned of potential exits. The app's blue "Up Swell" and orange "Down Crash" animations made momentum shifts obvious even to beginners.
Beyond pretty visuals, WaveTrader's backtesting let me validate my strategy against years of historical data. This meant testing trading patterns across bull markets, bear markets, and sideways chop before risking real money. The app's risk-based stop-loss system provided peace of mind throughout each trade.
Catching Your Own Wave: How to Apply This Strategy
The pattern worked for me—now it's your turn to test these waters. Unlike complex trading systems that require months to master, this approach breaks down into simple, repeatable steps that work whether you're managing $1,000 or $100,000.
Step-by-Step Entry and Exit Rules
Start with clear entry rules. Hunt for consolidation patterns where price compresses like a coiled spring before breaking out. The strongest setups occur when multiple indicators align—specifically when price breaks above key resistance with increasing volume. Here's your entry checklist:
- 1. Confirm trend direction using moving averages (12/26 EMA crossover)
- 2. Wait for price to break through significant resistance or pull back to strong support
- 3. Verify momentum shift with RSI crossing above 50 and MACD showing a bullish crossover
- 4. Check volume confirmation—volume should increase on breakout moves
Exit planning happens before you enter. Never leave a trade without predetermined take-profit and stop-loss levels. Set stop-losses just below significant support levels to limit potential losses. The staged exit strategy I used works across different position sizes—taking 30% profits at your first target, 40% at the second, and riding the remainder to your final exit.
Choosing the Right Crypto Assets
Asset selection can make or break your success rate. Focus on cryptocurrencies with sufficient liquidity and market capitalization to ensure clean entries and exits without slippage. Bitcoin and Ethereum provide reliable swing trading opportunities given their established trend patterns and high volume.
Skip the low-cap altcoins for now. Instead, prioritize coins with:
- ✓ High trading volume and liquidity
- ✓ Clear technical patterns on charts
- ✓ Strong fundamental backing
- ✓ Volatility sufficient for meaningful swings
Start with 1-2 major cryptocurrencies rather than spreading yourself thin. Master Bitcoin's personality before moving to Ethereum. Each asset has its own rhythm—learn one thoroughly before adding complexity.
Setting Up Alerts and Automation
Smart traders work smarter, not harder. Set up customized price alerts through platforms like TradingView. These notifications can track support/resistance breaks, indicator crossovers, or volume surges. You'll catch opportunities without staring at charts all day.
WaveTrader simplifies this further by highlighting "Paddle Zones" (buy signals) and "Wipeout Zones" (sell indicators) through color-coding. The visual approach makes pattern recognition more accessible for beginners who find traditional charts overwhelming.
Automation removes emotion from execution. Set automated stop-losses and take-profits immediately after entering positions. This eliminates the temptation to "hold just a little longer" or exit too early when fear kicks in. Your predefined rules handle the discipline while you focus on finding the next setup.
Risk Management and Mindset for Swing Trading
Even the most perfect wave reading won't save you if you don't respect the ocean's power. The same applies to crypto swing trading—your pattern recognition skills mean nothing without proper risk management and the right trading mindset. These aren't optional extras; they're the difference between riding waves for years versus getting wiped out on your first big swell.
Using Stop-Loss and Take-Profit Levels
Think of stop-losses as your trading leash—they keep you from getting dragged too far out to sea. Setting proper stop-loss orders is non-negotiable in crypto trading. These orders automatically trigger when price reaches predetermined levels, limiting potential losses. Position your stop-loss just below support levels for long positions or above resistance for short positions. Most importantly, never risk more than 1-2% of your total capital on any single trade.
Here's the golden rule: decide your exit before you enter.
For take-profits, smart traders use a staged approach instead of going all-in on one exit point. This strategy allows you to secure partial profits while letting winners run. A solid approach sets your risk-reward ratio at least 1:2 or higher, ensuring potential profits outweigh potential losses. These principles apply whether you're trading ABC patterns or any other setup.
WaveTrader simplifies this whole process by visually marking optimal exit points with red "Wipeout Zones" that appear near resistance levels, helping even beginners implement effective risk management without getting lost in complex calculations.
Avoiding Emotional Decisions
Fear and greed are the two biggest wipeouts waiting for crypto traders. Emotional trading—driven by fear, greed, or FOMO—leads to impulsive decisions and potential losses. When Bitcoin suddenly drops 10%, your gut screams "sell everything!" When it rockets 20%, your brain shouts "buy more!" Both reactions can sink your portfolio.
FOMO (Fear of Missing Out)
The emotional impulse to enter trades based on seeing others profit or prices rapidly rising, often leading to buying at peaks. In crypto, FOMO drives many traders to abandon their strategy and chase pumps—like paddling frantically toward a wave that's already passed you by.
The solution? Establish clear trading rules before entering positions. Write them down. Stick to them. These predefined guidelines help you stick to your strategy regardless of market volatility.
Remember that disciplined thinking requires practice. During volatile periods, rely on your predetermined plan rather than reacting to market noise. Ask yourself: "What would I tell a friend to do in this situation?" Often, that outside perspective cuts through the emotional fog.
Tracking Trades with a Journal
Your trading journal acts as your personal wave report—tracking what worked, what didn't, and why. Record essential details for each trade:
- 📝 Date, time, and cryptocurrency pair
- 📝 Entry/exit prices and position size
- 📝 Technical indicators used
- 📝 Emotional state during the trade
Don't just log the numbers. Note how you felt during each phase of the trade. Were you anxious after entering? Did you second-guess your exit strategy? These emotional patterns often reveal more about your trading than the technical analysis itself.
Regular review of your journal reveals patterns in both winning and losing trades. Calculate key metrics like win rate and risk-reward ratio to refine your strategy over time. This self-reflection process creates a feedback loop that turns every mistake into wisdom for future trades.
🤔 Frequently Asked Questions
How is swing trading different from day trading crypto?
Swing trading holds positions for days or weeks instead of hours, requiring only 1-2 hours daily for analysis versus 6-8 hours for day trading. You pay fewer trading fees, experience less stress, and can keep your day job. Swing trading focuses on capturing 10-30% moves that develop over time, while day trading chases every minor price fluctuation.
What indicators are best for swing trading crypto?
The most effective combination includes RSI for momentum, MACD for trend confirmation, moving averages (12/26 EMA) for direction, Fibonacci retracement for entry points, and volume analysis for confirmation. The key is using multiple indicators together for confluence rather than relying on any single tool.
How much capital do I need to start swing trading crypto?
You can start with as little as $1,000, but never risk more than 1-2% of your capital on any single trade. For example, with $5,000 capital, risk only $50-100 per trade. This ensures you can survive losing streaks while building experience. Position sizing matters more than account size.
What timeframes work best for crypto swing trades?
Use 4-hour charts for precise entry timing and daily charts for trend confirmation. Trades typically last 5-14 days to capture meaningful price swings. Weekly charts help identify major support/resistance zones, while 1-hour charts can fine-tune your exact entry points.
Should I swing trade Bitcoin or altcoins?
Start with Bitcoin or Ethereum for their liquidity, established patterns, and reliable technical levels. These major cryptocurrencies move with purpose and follow predictable patterns. Avoid low-cap altcoins until you master the basics, as they lack sufficient volume and can be manipulated easily.
Riding Your Own Perfect Wave
Finding your trading rhythm takes time—but the payoff can change everything. This pattern generated $50K not because it was complicated, but because it combined simple tools most traders ignore. When moving averages, volume, and support levels sing in harmony, even crypto's wildest swings become predictable.
The real secret? Patience beats speed every time. While others chase every market ripple, you can position yourself for the waves that actually matter. Those 10-30% moves that build over days, giving you time to think instead of react. For those tracking their crypto taxes, swing trading's fewer transactions also simplify your tax reporting.
Yes, crypto markets will test your nerves. Prices can drop 20% overnight or moon during your lunch break. That's why predetermined rules matter more than perfect predictions. Set your stops, plan your exits, and let the market come to you.
For those still intimidated by traditional charts, WaveTrader's visual approach removes the guesswork. Green "Paddle Zones" and red "Wipeout Zones" turn complex analysis into simple color signals. Think of it as having a surf instructor who spots the best waves before you even see them forming.
Start small. Master one setup before moving to the next. Your trading journal will become your best teacher—track what works, what doesn't, and why. Every losing trade contains lessons worth more than the money it cost. Understanding crypto trading basics helps avoid expensive lessons that cost me $10,000 in mistakes.
The crypto ocean offers endless opportunities for those who learn to read its rhythms. Whether you're riding Bitcoin's massive swells or catching smaller altcoin waves, these principles work across all timeframes and market conditions.
Your $50K pattern is out there waiting. The question isn't whether the next big move will come—it's whether you'll be ready when it does.
Disclaimer: This article is for educational and informational purposes only. It does not constitute financial, investment, or trading advice. Cryptocurrency markets are volatile and carry significant risk. Past performance does not guarantee future results. Always do your own research and consider consulting a qualified financial advisor before making any investment decisions.