Quick Answer
Crypto market analysis for beginners involves understanding two main approaches: Technical Analysis (reading price charts and patterns) and Fundamental Analysis (evaluating the project's value). Start with simple charts, identify trends, learn basic indicators like support/resistance levels, and use visual tools that simplify complex data into intuitive signals.
Key Takeaways
- 1. Market analysis helps turn crypto trading from gambling into informed strategy
- 2. Technical analysis uses charts and patterns; fundamental analysis examines project value
- 3. Start with major coins, simple timeframes, and basic trend identification
- 4. Visual tools with color-coded signals make complex analysis accessible to beginners
- 5. Practice with paper trades before risking real money, and always manage your risk
If you're new to cryptocurrency trading, the charts and data can feel intimidating at first. (In our previous article, "Crypto Trading Analytics Made Simple," we looked at how to master crypto indicators. Now, let's shift focus to you – the beginner trader – and demystify the basics of crypto market analysis.) Market analysis might sound technical, but it simply means learning to understand why prices move and how to make informed trading decisions. In this guide, we'll break down the fundamentals of crypto market analysis in a friendly, visual way – so you can start riding the market waves with confidence, instead of wiping out.
Why Do Beginners Need Market Analysis?
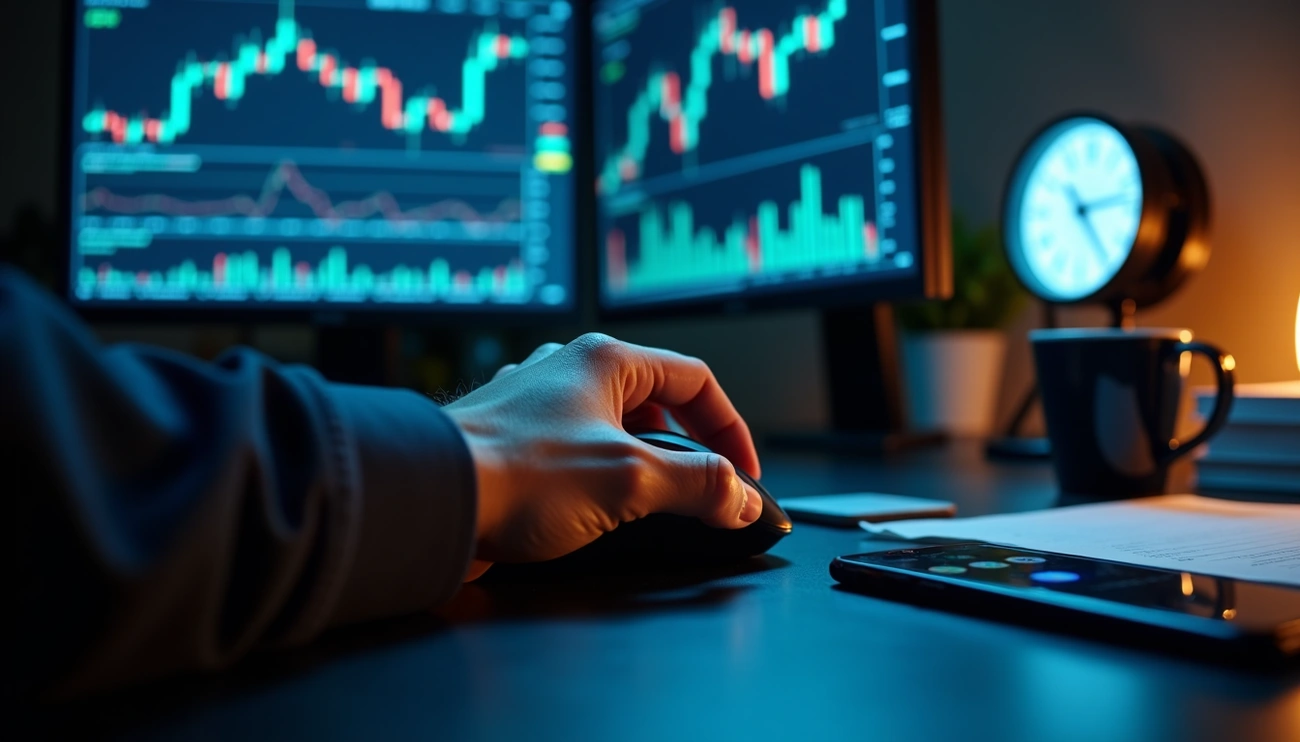
Many first-time crypto traders dive in on hype or gut feelings, only to get caught off guard by sudden price swings. Cryptocurrency markets are famously volatile, with Bitcoin sometimes jumping 5% in an hour or crashing 10% overnight. Relying on luck or social media tips is like surfing without checking the weather – you might ride a wave, but you're just as likely to wipe out. This is where market analysis comes in. By learning to read charts and trends, you turn guessing into informed strategy.
As one beginner put it, a crypto chart initially looked "like a chaotic mess of lines and candles, like trying to read an alien language". But once you learn the basics, "technical analysis, the art of using charts to forecast price movements, is your ticket to trading smarter". In short, understanding market analysis helps level the playing field – so you're not just tossing a coin and hoping for the best.
Technical vs. Fundamental Analysis: Two Sides of the Coin
When traders talk about market analysis, they generally mean two things: technical analysis and fundamental analysis. These are the twin tools that even professional traders use, and as a beginner you should know the basics of both:
- Technical Analysis – This is all about the price charts. Technical analysts study past price movements and patterns (using candlestick charts, trend lines, indicators, etc.) to predict future behavior. It's like forecasting the ocean's waves by observing past wave patterns. Technical analysis "examines price charts and patterns" to identify trends and potential turning points. In crypto, where prices can change rapidly, technical analysis is especially popular for short-term trading decisions.
Definition:
Technical Analysis: A method of evaluating securities by analyzing statistics generated by market activity, such as past prices and volume. Technical analysts use charts and other tools to identify patterns that can suggest future activity.
- Fundamental Analysis – This looks at the bigger picture behind a cryptocurrency. Instead of charts, fundamental analysts examine factors like the project's technology, adoption, team, news, and overall market demand. It's akin to checking the weather and tide conditions before sailing. In other words, fundamental analysis evaluates a crypto project's intrinsic value (what it's actually worth, based on its utility and fundamentals). For example, a beginner doing fundamental analysis might read a coin's whitepaper, follow crypto news, or track how many people are using a particular blockchain network.
Definition:
Fundamental Analysis: A method of evaluating a security's intrinsic value by examining related economic, financial, and other qualitative and quantitative factors, including the overall economy, industry conditions, and company management.
Neither approach is "better" on its own – in fact, combining both gives the best insight. A savvy trader uses technical analysis to time their buys and sells, while also using fundamental analysis to choose solid projects and understand market drivers. As Investopedia notes, evaluating cryptocurrency requires combining technical analysis, fundamental research, and risk assessment. In practice, this means you might use charts to decide when to enter a trade, but use fundamentals to decide what to trade and why. By covering both sides, beginners can avoid common pitfalls like buying an overhyped coin with weak fundamentals or holding a great coin but at the wrong time.
Getting Started with Technical Analysis (TA)
So, how can a beginner actually start doing technical analysis? Don't worry – you don't need to be a math whiz or a professional trader to grasp the basics. Here are some beginner-friendly steps and tips to start analyzing crypto markets using technical tools:
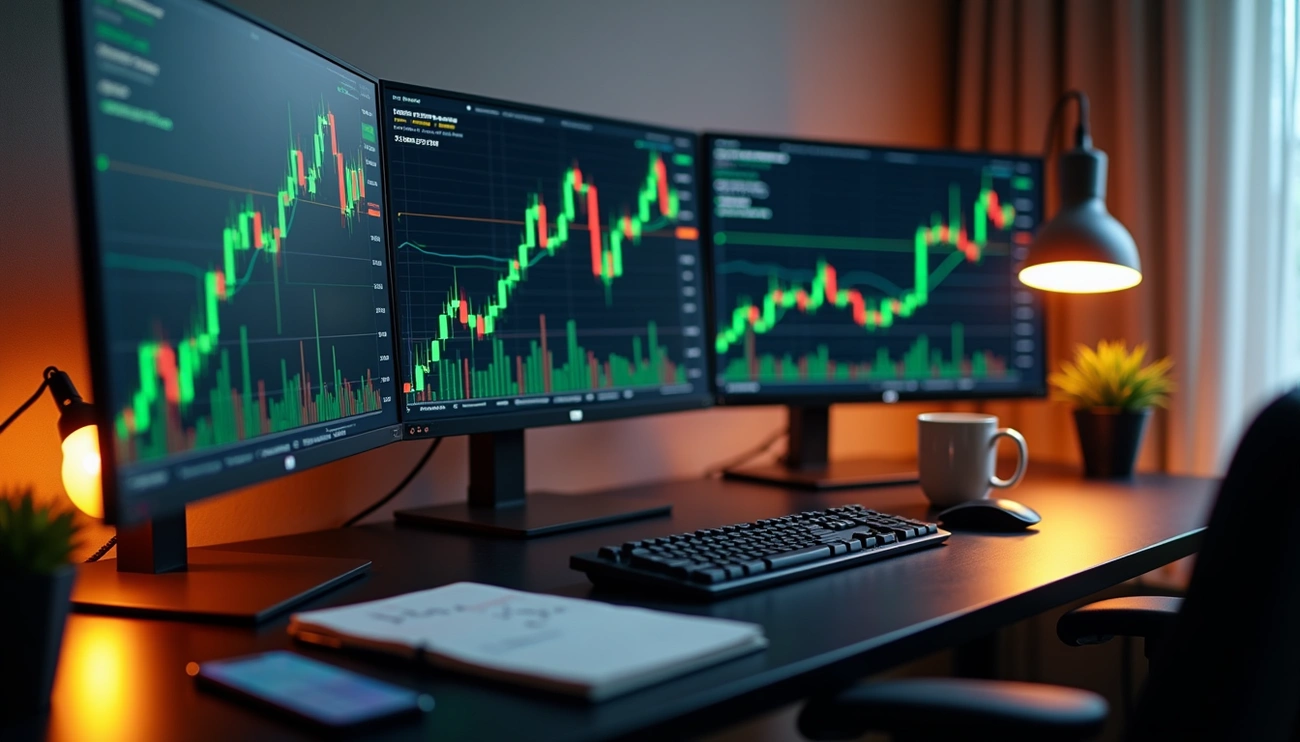
- Start with a Simple Chart: Pick a major cryptocurrency (like Bitcoin or Ethereum) and bring up its price chart on a beginner-friendly platform. Many traders use free charting tools like TradingView or the built-in charts on crypto apps. Switch to a timeframe that isn't too noisy – for example, the 1-day or 4-hour chart – which shows broader trends rather than frantic minute-by-minute ticks.
- Identify the Trend: Look at the chart and ask, "Is the price generally going up, down, or moving sideways?" Recognizing the overall trend (bullish, bearish, or ranging) is crucial. Trends are like the ocean's current – you're more likely to succeed trading with the current than against it. If you see higher highs and higher lows, the market is in an uptrend (rising waves); lower highs and lower lows indicate a downtrend.
- Learn Key Chart Elements: Familiarize yourself with candlesticks (those green/red bar shapes on the chart) – each candlestick shows the price's ups and downs in your chosen time frame.Understand support and resistance levels: a support is a price level where the coin tends to stop falling (think of it as a "floor"), and resistance is where it tends to stop rising ("ceiling"). These levels matter because they hint at where traders commonly buy (at support) or sell (at resistance).
Key Terms:
Support Level: A price level where a downtrend can be expected to pause due to a concentration of demand or buying interest. Think of it as a "floor" that prevents the price from falling further.
Resistance Level: A price level where an uptrend can be expected to pause due to a concentration of supply or selling interest. Think of it as a "ceiling" that prevents the price from rising further.
- Use One or Two Indicators: Indicators are tools that overlay on your chart to provide extra insight. As a beginner, you might start with a moving average (which smooths out price data to show the overall direction) or volume (which shows how much trading is happening). Another beginner-friendly indicator is the Relative Strength Index (RSI), which can suggest if a coin is "overbought" or "oversold" (implying a possible reversal). Don't overload your chart with too many indicators at first – keep it simple and observe how price reacts around these basic indicators.
- Observe Patterns: Over time, you'll notice common chart patterns (like double tops, ascending triangles, or breakouts). For instance, a breakout happens when price "breaks" out of a previous range or pattern – a moment many traders see as a signal for a strong move (this concept inspired our app's "Break Signal", which alerts users to major momentum breaks). As a beginner, focus on just one or two simple patterns, and practice spotting them in historical data. It's like learning to recognize the shape of a wave before you try to surf it.
Remember, technical analysis is a skill developed with practice. At first, all these lines and patterns may seem confusing. But as you practice reading charts, you'll start noticing how a coin's price tends to behave, just like a surfer learns to recognize the ocean's moods. And importantly, TA helps you trade based on evidence (price data) rather than emotion or hype. As one crypto trader noted from experience, technical analysis "helps you spot patterns, predict trends, and make informed trades instead of guessing". In other words, it brings a bit of science to the art of trading.
Simplifying Analysis with Visual Tools and Analogies
A smartphone displaying a crypto trading chart, with clear indicators overlaid. Intuitive, visual tools (especially on mobile) can make crypto market analysis less intimidating for beginners.
Many new traders are visual learners – they understand concepts better when they can see them. However, the raw financial data in crypto can be overwhelming for anyone at first. The inherent complexity of crypto market data can be "overwhelming for users," with prices fluctuating wildly in short periods. The challenge (for both educators and app designers) is to simplify this complexity without losing important information. This is where visual tools and creative analogies can be a game-changer for beginners.
One effective approach is using color-coded signals and simple graphics to represent complex market trends. For example, our crypto analysis app takes a fun surf-inspired approach to visualize trading signals. We use bold wave overlays on the price chart – blue "Up Swell" waves to indicate upward momentum and orange "Down Crash" waves to show downward momentum. Key buy and sell zones are highlighted as well: a green "Paddle Zone" appears on the chart when conditions look optimal for buying (as if you're paddling to catch an incoming wave), and a red "Wipeout Zone" flags a potential drop or sell signal (warning you of a possible wipeout ahead). We even label major breakout moments with a "Break Signal," signifying a critical surge or break in the trend (like a surfer catching that big break in the waves).
Why go through the trouble of surf analogies and colorful visuals? Because visual cues help traders grasp market dynamics at a glance, facilitating quicker and deeper understanding. Instead of deciphering a tangle of lines and numbers, a beginner can immediately see "oh, there's a big blue wave forming – an upward trend might be building" or "a red zone just flashed – time to be cautious." Research in user experience shows that clear visualizations (graphs, icons, colors) can translate dense data into intuitive signals, enabling users to make sense of complex information faster. In plainer terms, a good visual tool turns learning into seeing.
Moreover, a mobile-friendly, intuitive interface means you can study the market on the go without feeling lost. Many beginners trade on their phones, so we ensured our dashboard is clean and not cluttered by technical jargon. For instance, instead of listing a dozen technical indicator values, the app distills insights into those surf-themed indicators and plain-language tips. This way, even if you're still learning what "RSI" or "MACD" mean, you can follow the spirit of the market by watching the waves and zones on your screen. By integrating an in-app "Surf School" (an educational section with bite-sized lessons and analogies), we also encourage new users to learn why those signals occur. The goal of all these visual and educational tools is simple: make market analysis feel approachable. Just as training wheels help you ride a bike, an intuitive visual interface helps you ride the crypto waves until you gain the confidence to dive into more advanced analysis.
Practice, Patience, and Ongoing Learning
Finally, remember that becoming proficient in market analysis (or trading in general) takes practice and patience. Don't be discouraged by early mistakes – every expert trader was once a beginner who didn't know a candlestick from a traffic candle! Start small and apply what you learn step by step. For instance, you might do a "paper trade" (simulated trade on paper or in an app demo) before risking real money, to test if your analysis was on point. Many trading platforms and apps (including ours) offer watchlists, price alerts, or even sandbox modes that let you track how your decisions would play out without real stakes. Use these features to your advantage as learning tools.
Keep in mind that the crypto market is influenced by many factors – not just the charts. Major news, regulatory updates, or shifts in investor sentiment can all cause the market to move. This means you should stay curious and keep learning. Read up on your favorite coins (fundamentals), follow reputable crypto news sources, and observe how such events reflect on the charts. Over time, you'll start connecting the dots – for example, seeing how a positive development (like a big company adopting a cryptocurrency) creates an "up swell" of momentum, or how fear in the market can lead to a "down crash" pattern.
Most importantly, manage your risk as you learn. Simple measures like setting a stop-loss on your trades (an automatic sell if price drops too far) or not investing more than you can afford to lose will protect you while you ride these learning waves. Every trader, beginner or pro, hits the occasional rough patch – what matters is that you learn from each experience. If a trade goes wrong, review it: Did you misread a signal? Was there unforeseen news? Each mistake can teach you something for next time.
Conclusion
By focusing on core analysis skills and leveraging beginner-friendly tools, you'll gradually turn that "alien language" of crypto charts into a familiar one. Start with the basics of technical analysis, pay attention to fundamental news, and try using visual signals or analogies (like our surf-themed ones) to reinforce your understanding. With time, the market's ups and downs will feel less like random chaos and more like waves that you know how to navigate. Stay patient, keep practicing, and soon you'll be riding those crypto market waves with confidence instead of fear. 🌊🏄♂️
Want to learn more? Be sure to check out our previous blog post Crypto Trading Analytics Made Simple: Ride the Market Waves if you're curious about mastering specific crypto indicators like RSI and moving averages. And as always, happy trading and happy learning – we'll see you on the next wave!
Continue Your Trading Education
Ready to dive deeper? Check out these related guides:
Frequently Asked Questions
What is technical analysis in crypto trading?
Technical analysis examines price charts and patterns to predict future price movements. It uses tools like candlestick charts, trend lines, and indicators to identify trends and potential turning points. In crypto markets, technical analysis is especially popular for short-term trading decisions.
What is fundamental analysis in cryptocurrency?
Fundamental analysis evaluates a cryptocurrency's intrinsic value by examining factors like the project's technology, adoption, team, news, and overall market demand. It looks at the bigger picture behind a cryptocurrency rather than just price charts.
How do beginners start with crypto market analysis?
Beginners should start with simple charts on major cryptocurrencies, identify basic trends (up, down, or sideways), learn key chart elements like support and resistance levels, use one or two basic indicators like moving averages or RSI, and practice spotting simple patterns before risking real money.
What are support and resistance levels in crypto?
Support is a price level where a cryptocurrency tends to stop falling (like a floor), while resistance is where it tends to stop rising (like a ceiling). These levels matter because traders commonly buy at support and sell at resistance, creating self-fulfilling price behaviors.
Should beginners use technical or fundamental analysis?
Neither approach is better on its own – combining both gives the best insight. Use technical analysis to time your buys and sells, while using fundamental analysis to choose solid projects and understand market drivers. This combination helps avoid buying overhyped coins or holding great coins at the wrong time.
Sources:
- John (2025). "How to Read Crypto Charts Like a Pro: Technical Analysis for Beginners." – Medium
- Investopedia (2024). "How to Evaluate and Analyze Cryptocurrency." – on combining technical & fundamental analysis
- Lazarev Agency (2023). "Effective Design Principles for Cryptocurrency Trading Interfaces." – on simplifying complex data with visual design
Disclaimer: This article is for educational and informational purposes only. It does not constitute financial, investment, or trading advice. Cryptocurrency markets are volatile and carry significant risk. Past performance does not guarantee future results. Always do your own research and consider consulting a qualified financial advisor before making any investment decisions.