Quick Answer
90% of crypto traders fail not because of bad analysis, but because emotions override their strategy. Market cycles follow predictable psychological patterns: Accumulation, Markup, Distribution, and Markdown. By learning to read these emotional waves—using visual tools instead of reacting to hype—you can position yourself ahead of the crowd and stop buying tops or selling bottoms.

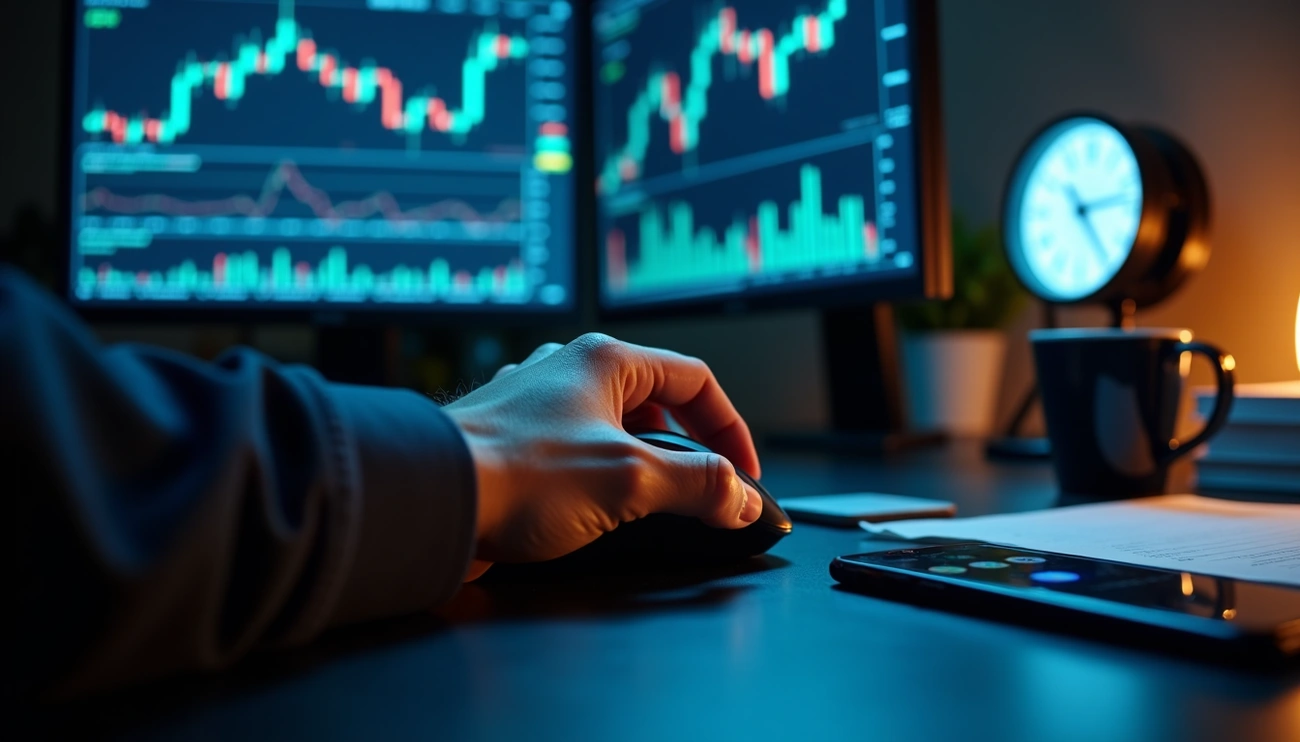
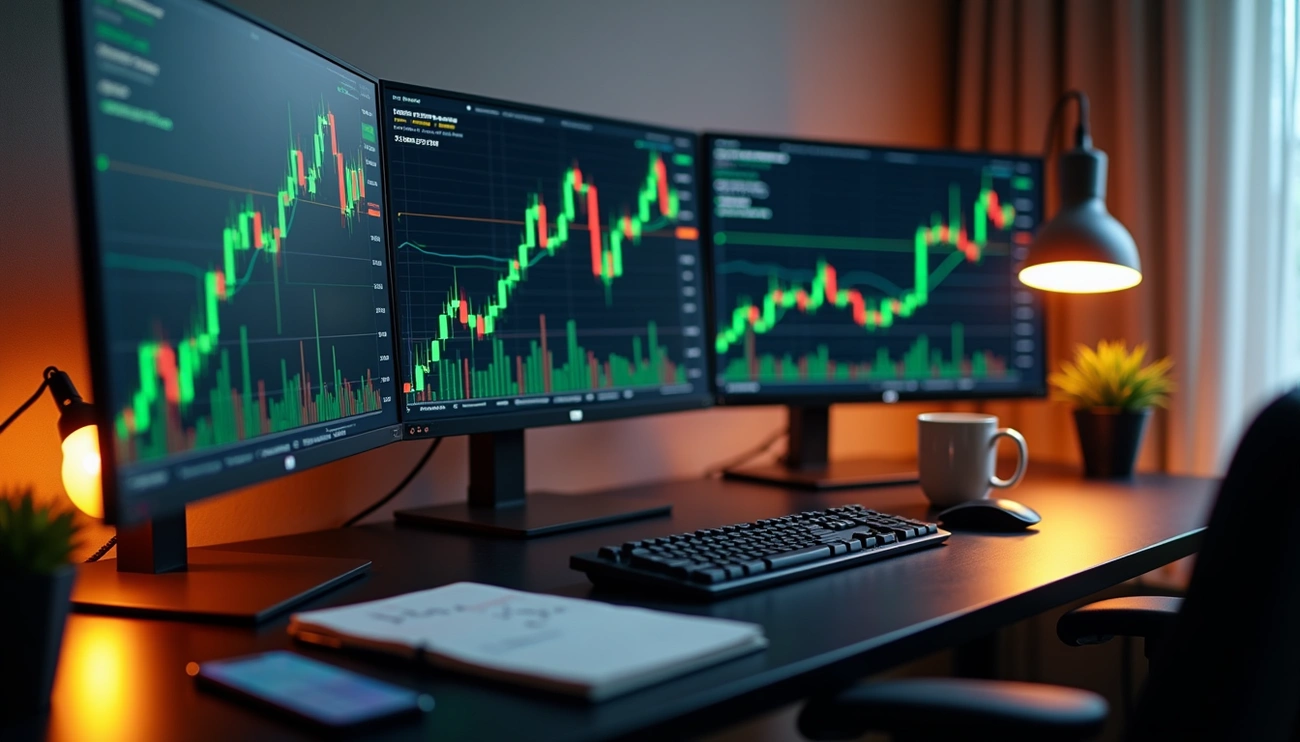
The crypto ocean churns with emotional currents that create some of the wildest financial waters you'll ever paddle through. These aren't gentle market ripples—we're talking about massive psychological swells that can either lift your portfolio to new heights or drag it into the depths. Here's the brutal truth: 90% of traders get wiped out not by bad technology or weak fundamentals, but by their own emotions.
Watch any crypto market for five minutes and you'll see it—pure herd mentality in action. When Bitcoin breaks resistance, suddenly everyone's a genius buying the top. When it crashes through support, panic spreads faster than a riptide, with traders following each other straight into the rocks.
Market psychology drives everything. Price movements aren't spreadsheet calculations—they're emotional reactions played out in real-time. Ever wonder why smaller altcoins swing 50% in a day while Bitcoin moves 10%? The smaller the market, the bigger the emotional waves. Bull markets feed on hope and greed, pushing prices higher. Bear markets gorge on fear and despair, pulling everything down.
Here's something that'll blow your mind: over 70% of traders place their big orders at round numbers like $10,000 or $50,000. These psychological price levels become massive support and resistance zones—not because of any fundamental reason, but because our brains love neat, round numbers.
Most traders paddle against the current their entire careers. They react to waves after they've already crashed over them. How do you catch the swell without getting slammed by the emotional undertow?
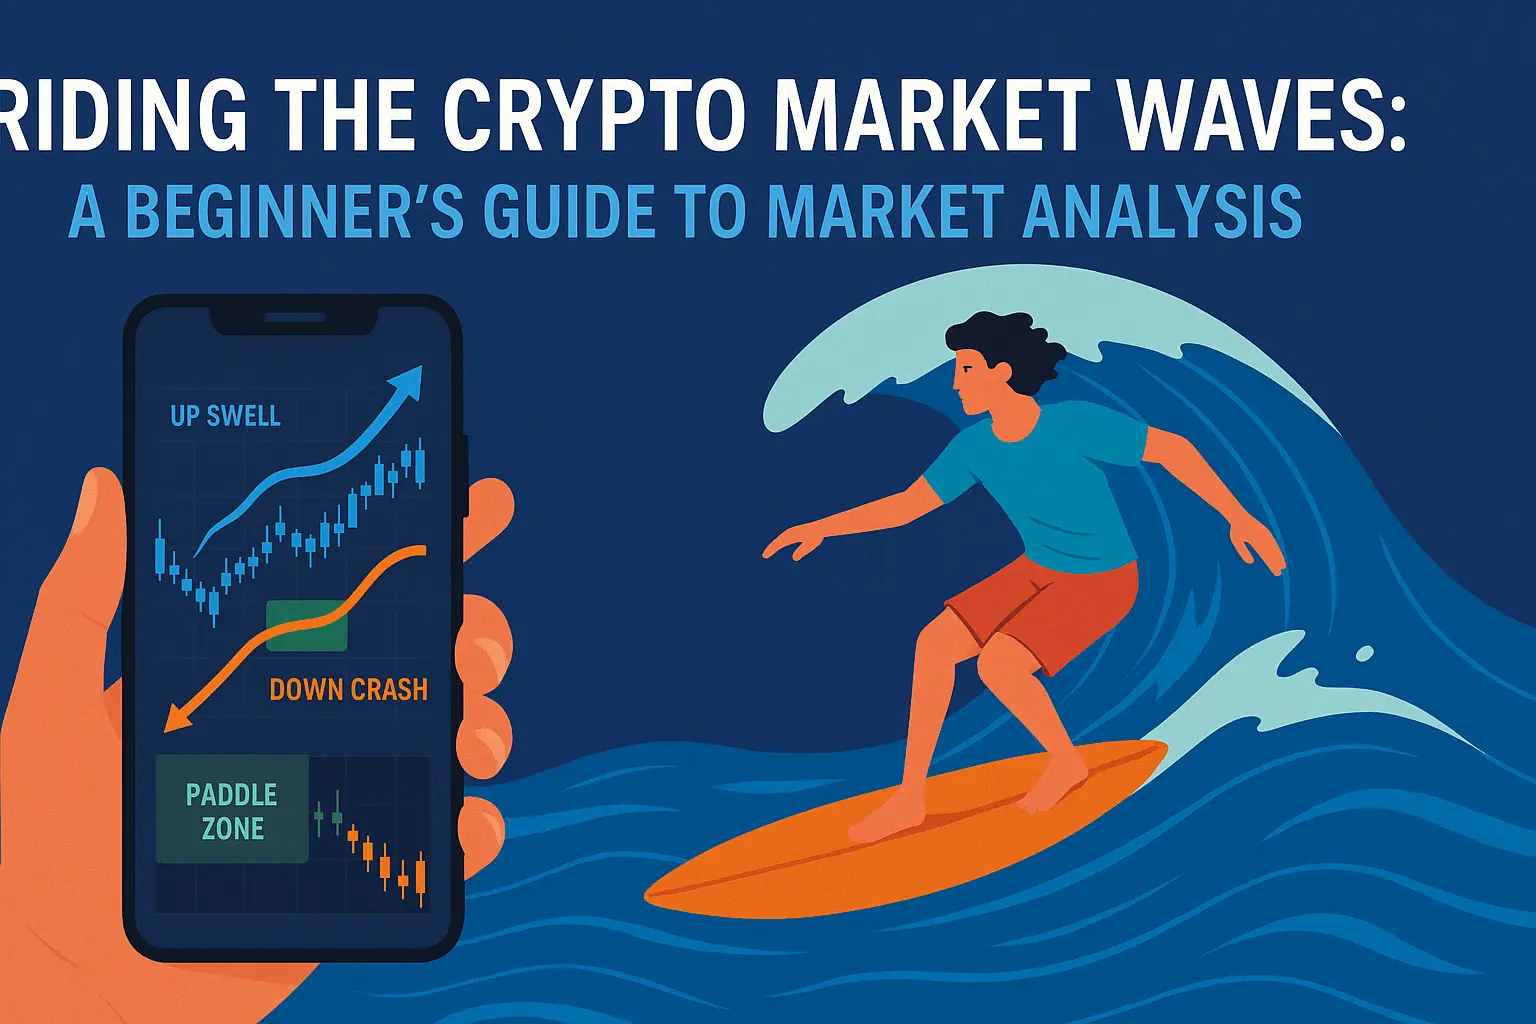
The secret lies in reading these emotional waves before they peak. Visual tools that turn complex market psychology into simple wave patterns can help you spot when the crowd leans too far in one direction—exactly when the biggest opportunities appear. Let's dive into what the majority gets wrong and how you can stay ahead of the emotional tide.
🔑 Key Takeaways
- Emotions beat analysis: 90% of traders fail because they buy during euphoria and sell during panic—the exact opposite of what works
- Four predictable phases: Accumulation, Markup, Distribution, and Markdown repeat in every market cycle
- Visual tools outperform: Reading wave patterns helps spot emotional extremes before the crowd catches on
- Set rules when calm: Build your trading plan during boring markets, not during emotional storms
Understanding the Market Cycle Phases
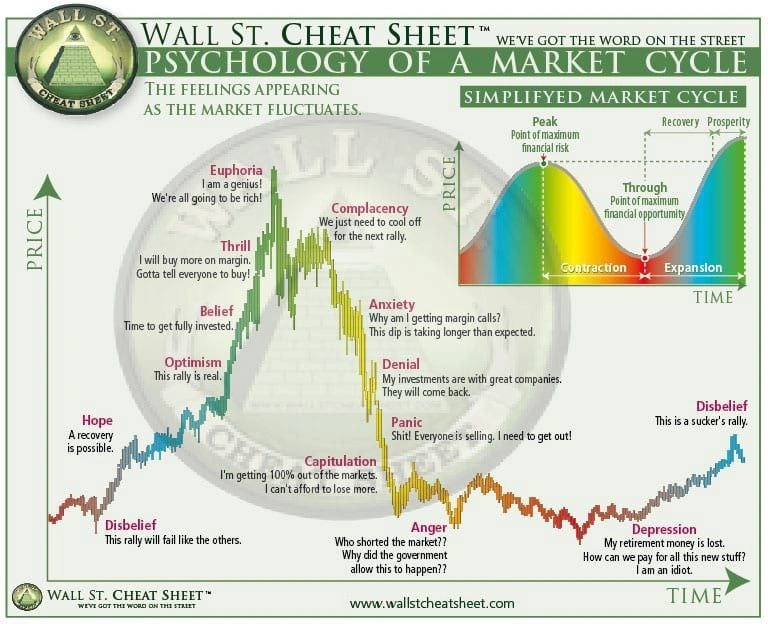 Image Source: Medium
Market cycles roll through the same emotional patterns again and again, like seasonal storms hitting the same coastline. These aren't random price movements—they're predictable waves of human psychology playing out in real-time. Master these four phases and you'll stop reacting to markets and start anticipating them.
Accumulation: The quiet before the storm
Picture the ocean on a still morning after yesterday's hurricane. The surface looks calm, almost boring. Volume drops to whispers. Most traders have fled the scene, licking their wounds from the previous crash. Uncertainty hangs thick in the air as prices drift sideways.
But beneath that deceptively flat surface, something powerful stirs. Smart money moves like shadows, quietly gathering positions while retail investors nurse their losses. Institutional buyers slice their orders thin, keeping their accumulation invisible. They know what most miss—this isn't stagnation, it's preparation.
This phase builds pressure like water gathering behind a dam. WaveTrader's visual patterns catch these hidden currents when the surface still looks dead calm.
Accumulation Phase
The period when smart money quietly builds positions while prices move sideways and retail sentiment remains negative. Volume is low and news coverage minimal. This phase sets the foundation for the next bull run—like the ocean gathering energy before a big swell arrives.
Markup: When optimism takes over
The storm breaks. Prices punch through resistance and start their steady climb skyward. Fresh faces appear as rising prices pull in new players, and volume surges back to life. Bitcoin typically leads this charge, blazing the trail for everything else to follow.
Watch the emotional shift happen in real-time. Fear transforms into hope, then hope into excitement. Every green candle validates the growing optimism. Media coverage turns positive. Social feeds buzz with success stories. Each price jump feeds the next one, creating a beautiful upward spiral.
Seasoned wave riders using visual trading tools can spot these momentum shifts early—right when the first real swell forms, before the crowd realizes the tide has turned.
Distribution: The peak of euphoria
Here's where it gets dangerous. Prices hit their peak, but something subtle changes beneath the surface. Early money starts taking profits while newcomers pile in, convinced this rocket ship only goes up. The market looks strong, feels invincible, yet cracks begin forming in the foundation.
You get this fascinating split-screen drama: one group scrambling to buy (terrified they'll miss the final moonshot) while another quietly heads for the exits (recognizing the party's almost over). Volume stays heavy, but momentum starts stuttering.
This is where assets flow from smart hands to naive ones. "Bull traps" spring like hidden snares, yanking prices higher just long enough to catch the last wave of buyers before the real reversal hits.
Reading distribution requires eagle eyes for subtle pattern shifts that escape most traders. Visual wave analysis turns these complex formations into clear warning signals. Learning to spot key chart patterns during this phase can save your portfolio.
Markdown: Panic and capitulation set in
Supply overwhelms demand and gravity takes over. Fear replaces greed as mounting losses shatter confidence. What starts as "just a healthy correction" morphs into full panic as the selling accelerates. Even good news can't lift prices when negative sentiment floods every rational thought.
The emotional descent follows a brutal script:
Disbelief
"This is just a correction. It'll bounce back any day now."
Anxiety
"When will this stop falling? Maybe I should sell some..."
Capitulation
"I can't take the pain anymore. Get me out at any price!"
The cycle completes with capitulation—that moment when even die-hard believers throw in the towel and sell at crushing losses. Ironically, this peak despair plants the seeds for the next accumulation phase, and the whole dance starts over.
Here's the beautiful paradox: by seeing these emotional extremes as wave patterns, you gain the perspective that drowning traders lack. While others get caught in the emotional riptide, you can position for the next big swell—exactly what visual wave analysis helps you accomplish.
The Emotional Triggers Behind Each Phase
Raw emotion powers crypto markets harder than any fundamental analysis ever could. Each market phase creates specific psychological triggers that sweep through the trading community like storm surges—understand these patterns and you can position yourself ahead of the chaos.
FOMO during markup
When prices smash through resistance during markup, Fear Of Missing Out hits the crypto community like a perfect barrel wave that everyone wants to catch. Studies show FOMO drives rapid price spikes and wild volatility as traders pile in at once. Social media turns this into a feeding frenzy—Twitter, TikTok, and Reddit explode with success stories that make you feel like you're the only one still sitting on the beach.
The numbers tell the story: 81% of crypto holders admit FOMO influences their trading decisions. Picture the lineup when a perfect set rolls in—everyone paddling frantically, most getting in each other's way. WaveTrader's visual patterns help you spot these emotional surges before they crest, letting you paddle into position while others are still scrambling.
FOMO (Fear Of Missing Out)
The emotional urge to buy when prices are rapidly rising, driven by seeing others profit. FOMO typically peaks during late markup and distribution phases, causing traders to buy near tops. It's like paddling frantically for a wave after it's already breaking—you'll likely get pounded instead of riding it.
Greed at the top
Market peaks breed pure greed—the kind that makes surfers drop in on each other for one more ride. The Crypto Fear & Greed Index measures this emotional extreme, with readings above 75 flashing danger signals. Recently, the index hit "greed" at 61, showing appetite returning but not yet the reckless euphoria that marks major tops.
Greed shows up everywhere:
- 💸 Holding positions way too long, convinced the moon is next
- 🙈 Ignoring every warning sign because "this time is different"
- 🎰 Ditching risk management completely
- 📈 Maxing out leverage at the worst possible moment
It's like staying out for one more set when the tide's turning dangerous. WaveTrader's visual tools catch these emotional peaks by turning market madness into recognizable patterns you can actually read.
FUD during markdown
Once the tide turns, Fear, Uncertainty, and Doubt crash down like closeout sets that pummel everything in sight. FUD works as both genuine panic and calculated manipulation designed to shake out weak hands. The emotional destruction follows a brutal sequence: anxiety, denial, panic, anger, then total depression.
Fear spreads through crypto markets faster than a rip current, with panic jumping from one coin to another in minutes. This is exactly where revenge trading destroys accounts—traders trying to "make back" their losses by doubling down on emotion.
WaveTrader's visualization cuts through this emotional chaos, showing you when sentiment hits rock bottom—exactly where smart money starts positioning for the next cycle.
Hope and disbelief in recovery
Recovery phases create the ultimate emotional split—like half the lineup still shell-shocked from the last beating while the other half cautiously eyes the horizon for new swells. Early accumulators feel hopeful while burned traders can't believe anything good could happen again.
The "disbelief rally" marks that first sustained push higher that pulls markets out of the depths. Most dismiss it as a fake-out that'll crash back down.
This emotional contradiction creates perfect opportunities as exhausted sellers transfer assets to patient buyers at discount prices. WaveTrader's visual approach excels at highlighting these turning points where maximum doubt often signals the best entry zones.
What Most Traders Get Wrong About Market Psychology
Here's the hard truth: crypto traders keep drowning in the same psychological waters because they refuse to acknowledge that markets are emotional battlegrounds where feelings trump fundamentals every single time.
Misreading the cycle stages
Most traders couldn't spot their position in a market cycle if it smacked them with a surfboard. They mistake distribution phases for minor pullbacks. They see dead cat bounces and scream "bull market's back!" Research confirms what seasoned wave riders know: psychological distress—anxiety, depression, the whole mess—directly links to market volatility and risk. Instead of reading the ocean objectively, traders let their current emotions cloud their judgment.
Cycle transitions happen faster than you think, especially when things go south. You've heard it before: "Markets take the stairs up but the elevator down." Panic hits harder and spreads quicker than greed. While you're still wondering if this is just a dip, the emotional cascade has already swept half the market into the rocks.
Chasing trends instead of preparing for reversals
Rather than anticipating where the next wave breaks, most traders just follow the crowd off the cliff. Studies show many exhibit straight-up addictive behaviors—compulsively trading even while bleeding money. Social media makes it worse, turning every pump into FOMO fuel and every dump into panic selling.
Overconfidence Bias
You think you're the next crypto genius after one lucky trade
Disposition Effect
Selling winners too early, holding losers too long
FOMO Buying
Buying tops because everyone else is getting rich
WaveTrader's visual approach cuts through this emotional fog, showing you potential reversals before the herd notices them.
Ignoring the Wall Street Cheat Sheet
Despite being one of the most useful trading maps ever created, most traders completely ignore the Wall Street Cheat Sheet Psychology of a Market Cycle. This visual guide walks you through every emotional stage—from disbelief and optimism to euphoria and despair.
Want to know the only real difference between winners and losers? Emotional control. Profitable traders flip the script—they buy when everyone's scared and sell when everyone's greedy.
Failed traders have the right emotions at exactly the wrong times. They get excited and buy tops. They panic and sell bottoms. It's like they're designed to lose money.
WaveTrader's visualization tools help you break this cycle, turning emotional chaos into readable wave patterns you can actually surf instead of getting pounded by.
How to Use Visual Tools to Navigate Market Cycles
Visual tools act like your personal surf forecast, turning abstract market emotions into readable wave patterns you can actually use. These aren't fancy decorations for your charts—they're your navigation system through emotional chaos.
Reading a psychology of a market cycle chart
Market Cycle Chart
A visual roadmap that plots emotional states against price movements, showing the predictable journey from disbelief through euphoria and back to depression. Like a surf forecast that predicts wave height and timing—but for market emotions.
The Wall Street Cheat Sheet reveals the market's cruelest joke: crowds feel safest when danger peaks (market tops) and most terrified when opportunity blooms (market bottoms). Smart money plays the opposite game—they buy your fear and sell back your greed at premium prices.
These charts show you exactly where current sentiment sits in the emotional storm. The Wyckoff cycle breaks it down even cleaner with four stages: accumulation, markup, distribution, markdown. Each stage matches specific emotional states, making reversal points easier to spot before the crowd catches on.
Using visual wave charts to spot emotional extremes
Elliott Wave Theory turns market psychology into wave formations you can read like ocean swells. Understanding break signals becomes much easier when you see the underlying wave structure.
Impulse Waves
Where momentum builds like gathering storm energy—the trend's main direction with increasing volume and conviction.
Corrective Waves
Where trends weaken with choppy, sideways motion—the market pausing to catch its breath before the next move.
Reversal Zones
High-probability turning points at wave completion—where the emotional tide shifts and new opportunities emerge.
Wave 3 typically explodes with euphoria—this is mainstream adoption phase where everyone piles in. Wave 5 shows optimism but declining power—classic top signals that catch most traders buying the peak.
Reading wave structure keeps you anchored to objective patterns instead of getting swept away by crowd emotions. No more buying euphoric tops or panic-selling fearful bottoms.
How WaveTrader helps spot cycle transitions
WaveTrader transforms dense market data into intuitive wave visuals that make emotional extremes pop off your screen. Think of it as your market radar—spotting forming trends before they fully develop.
Visual Analysis Edge
Research proves visual chart models outperform pure numerical analysis, especially in volatile conditions. Your brain processes visual patterns faster than raw data, capturing subtle psychological shifts that numbers miss.
WaveTrader excels at highlighting critical transition moments—showing precisely when accumulation shifts to markup or distribution flips to markdown. Instead of getting caught in the emotional undertow that drowns most traders' accounts, you paddle into position ahead of major moves.
The platform's visual approach works because markets move in patterns, not random noise. Once you learn to read these emotional wave formations, you stop reacting to market movements and start anticipating them. For beginners just starting their crypto journey, building this visual intuition early creates a massive advantage.
Strategies to Stay Rational in an Irrational Market
Crypto markets will test every emotional weakness you have. The psychological waves we've explored create predictable traps that catch even experienced traders off guard. How do you keep your head above water when the emotional tide starts pulling you under?
Set rules before emotions take over
Smart traders build their seawalls during calm weather, not during the storm. Create your trading plan when markets are boring and your head is clear—because once the big swells hit, emotions will cloud every decision you try to make.
Stop-loss orders become your emergency paddle when fear starts drowning rational thought. Set these automatic triggers at predetermined levels. When greed whispers "just a little higher" or fear screams "get out now," your pre-set rules protect you from yourself.
Position sizing acts like your life jacket—it keeps you floating even when waves crash over your head. Trade smaller amounts and both your losses and emotional reactions stay manageable. You can't surf effectively if you're terrified of wiping out.
📋 Pre-Trade Emotional Checklist
- ✅ Have I set my stop-loss BEFORE entering?
- ✅ Is my position size small enough to lose without panic?
- ✅ Am I trading based on my plan or reacting to others?
- ✅ Would I enter this trade if no one else was watching?
Use data, not hype, to make decisions
Real-time data analysis turns trading from emotional gambling into calculated wave-reading. Instead of reacting to every Twitter rumor or Reddit post, focus on what the charts actually show. Technical indicators cut through social media noise and reveal objective signals rather than crowd sentiment.
WaveTrader's visual patterns help you see emotional extremes before they scramble your decision-making. When everyone else is paddling frantically toward the same wave, you'll already know whether it's worth riding or if it's about to crash.
Avoid herd behavior with independent analysis
Crypto markets amplify herd mentality like an echo chamber—especially when bearish sentiment takes hold. While everyone else follows the crowd toward the rocks, successful traders paddle in the opposite direction.
Do your own homework. Examine the technology, study the teams, understand the roadmaps. Diversify not just your portfolio but your information sources too. When every voice tells you the same thing, that's usually when contrarian opportunities appear.
WaveTrader's visual tools support independent thinking by highlighting market cycle transitions that most traders miss. While the crowd sees chaos, you'll spot the underlying patterns that create real opportunities.
🤔 Frequently Asked Questions
What are the four phases of a market cycle?
The four phases are: Accumulation (smart money quietly buys while prices are flat), Markup (prices rise as optimism spreads), Distribution (early investors sell to newcomers at the peak), and Markdown (panic selling drives prices down). Understanding these phases helps traders position ahead of emotional crowds.
Why do 90% of crypto traders lose money?
Most traders lose because they let emotions drive decisions. They buy during euphoria (near tops) when they feel confident and sell during panic (near bottoms) when they're scared. Successful traders do the opposite—they buy fear and sell greed by recognizing emotional extremes in market cycles.
What is FOMO in crypto trading?
FOMO (Fear Of Missing Out) is the emotional urge to buy when prices are rapidly rising, driven by seeing others profit. Studies show 81% of crypto holders admit FOMO influences their decisions. This typically leads to buying near market tops, as FOMO peaks during the late markup and distribution phases.
How can visual tools help with trading psychology?
Visual tools transform complex market data into readable wave patterns, making emotional extremes easier to spot. Research shows visual chart analysis outperforms pure numerical analysis in volatile conditions because our brains process visual patterns faster, capturing subtle psychological shifts that raw numbers miss.
What is the Wall Street Cheat Sheet?
The Wall Street Cheat Sheet is a visual guide mapping every emotional stage of a market cycle—from disbelief and hope through euphoria, then anxiety, panic, and depression. It reveals that crowds feel safest at market tops (maximum danger) and most terrified at bottoms (maximum opportunity).
Riding the Emotional Tide: Final Thoughts
Market cycles repeat the same emotional patterns over and over—yet most traders keep falling for the same psychological tricks. Every crypto winter, new traders panic sell at the bottom. Every bull run, fresh faces buy the euphoric top. The patterns never change, but the faces do.
Your success doesn't come from predicting every market move. That's impossible, and trying will drive you crazy. Success comes from recognizing when emotions reach extremes—those moments when the crowd leans so far in one direction that the market has to snap back the other way.
Here's the reality: 90% of traders have it backwards. They buy when they feel good about the market (usually near peaks) and sell when fear takes over (typically near bottoms). Meanwhile, seasoned traders do the opposite—they buy fear and sell euphoria.
The difference isn't intelligence or luck. It's perspective. Visual wave patterns show you these emotional extremes before the crowd recognizes them. When you can see a forming swell while others only notice choppy water, you get positioned before the big moves happen.
Psychology beats technical analysis every time. You can have the best indicators in the world, but if emotions override your execution, you'll still lose money. That's why the best traders set their rules during calm periods—before emotions cloud their judgment.
The crypto ocean will always be volatile. These emotional swells create the very opportunities that make trading profitable. But you need the right tools to spot them coming.
🎯 Final Key Takeaways
Read emotions, not just charts
Market psychology drives price movements more than any fundamental analysis
Set rules when calm
Create your trading plan before emotions take control during market chaos
Use visual tools
Wave patterns reveal emotional extremes that most traders miss entirely
Buy fear, sell euphoria
When the crowd feels safest, risk is highest—and vice versa
The market will keep throwing emotional waves at you. The question is: will you get tossed around by them, or will you learn to ride them? With the right visual tools and psychological awareness, you can position yourself ahead of the crowd instead of chasing moves after they've already happened.
Start reading the waves instead of just reacting to them. Your portfolio will thank you.
Disclaimer: This article is for educational and informational purposes only. It does not constitute financial, investment, or trading advice. Cryptocurrency markets are volatile and carry significant risk. Past performance does not guarantee future results. Always do your own research and consider consulting a qualified financial advisor before making any investment decisions.