Listen to This Article
Podcast Episode • 18 min
Quick Answer
Fibonacci retracement levels (23.6%, 38.2%, 50%, 61.8%, 78.6%) identify potential support and resistance zones during price pullbacks. Draw them from swing low to high in uptrends, or high to low in downtrends. The 61.8% golden ratio is the most watched level where trends often resume.
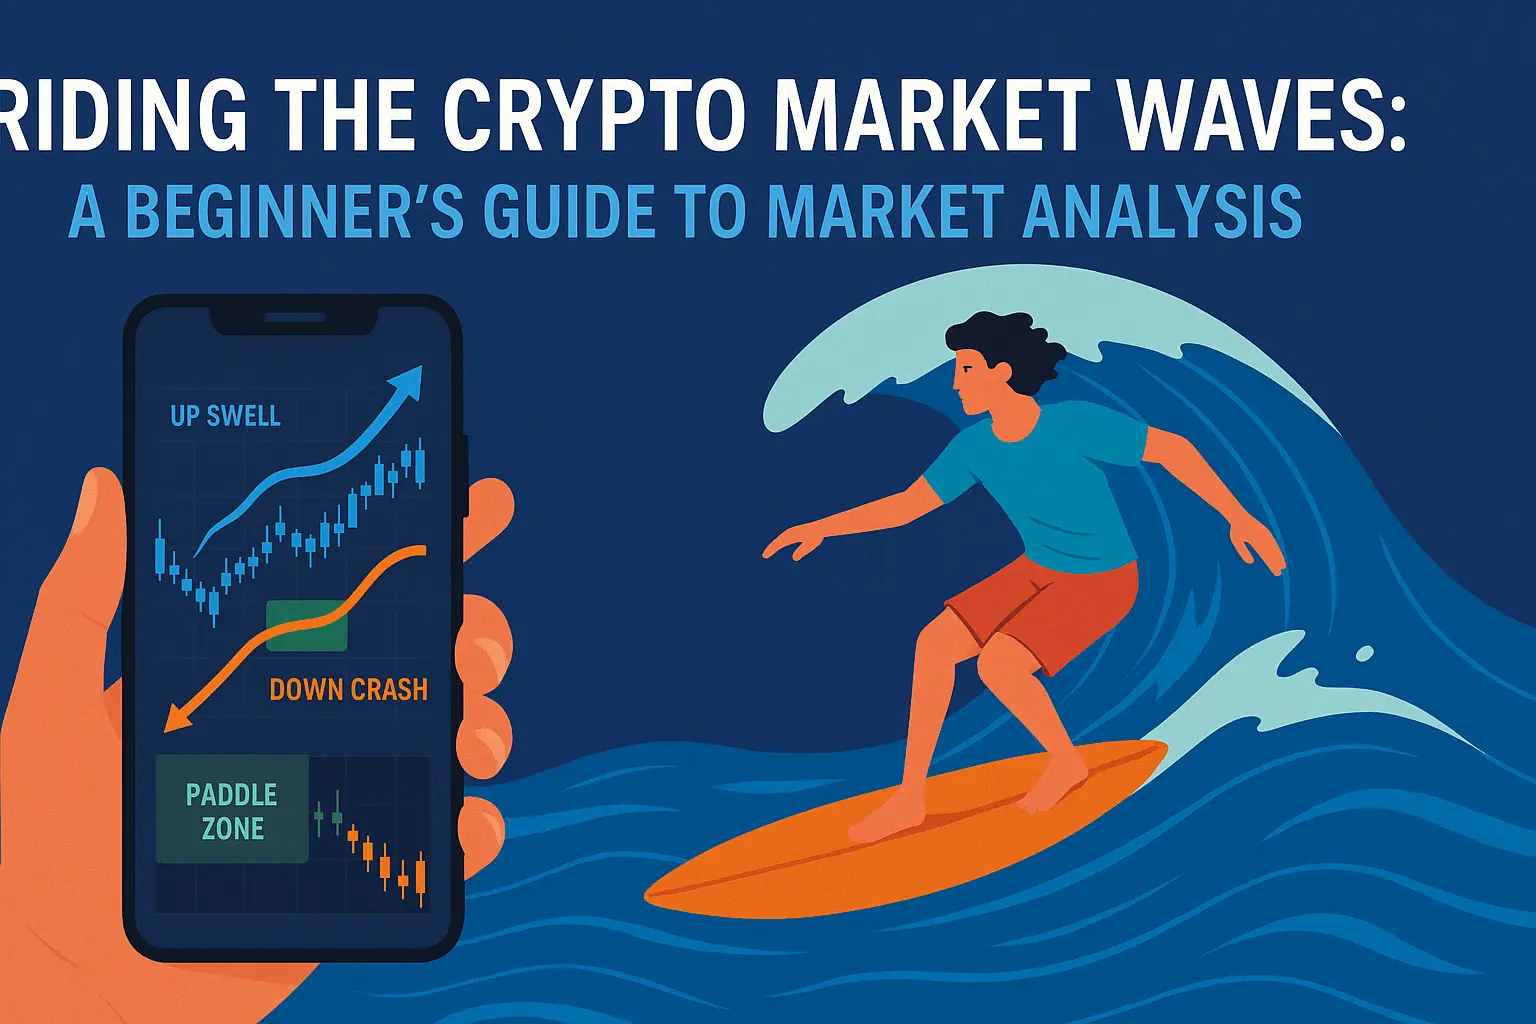
Market waves don't crash randomly—they follow ancient patterns hidden in plain sight. Fibonacci retracement levels reveal where prices pause, bounce, or reverse course, like natural tide lines carved into every chart. For traders using visual crypto analytics tools, these mathematical relationships become powerful navigation guides.
These aren't just random numbers floating on your screen. The mathematical relationships—23.6%, 38.2%, 50%, 61.8%, and 78.6%—spring from the same Fibonacci sequence that spirals through seashells, flower petals, and galaxy arms. For wave riders tracking market momentum, these levels mark potential turning points where buying and selling pressure shift.
Picture this: you're watching a strong uptrend when suddenly price starts pulling back. Where will it find support? Fibonacci levels act like invisible reef breaks—natural zones where the current often changes direction. Seasoned traders use these mathematical surf reports to time their entries, set protective stops, and target their exits.
But here's the key—these levels don't predict the future any more than weather reports guarantee perfect surf conditions. They simply highlight where the ocean's rhythm tends to pause, bounce, or continue its journey. Master these patterns and you'll start reading market waves like a local who knows every break.
Most trading platforms bury Fibonacci tools under layers of complex calculations and intimidating charts. The WaveTrader app transforms these mathematical relationships into visual wave patterns you can read at a glance—no spreadsheets required. Ready to decode the market's secret wave patterns?
🔑 Key Takeaways
- Five essential levels: 23.6%, 38.2%, 50%, 61.8%, and 78.6% mark critical support and resistance zones
- Golden ratio matters most: The 61.8% level often determines whether trends continue or reverse
- Combine with other indicators: RSI, MACD, and moving averages confirm Fibonacci signals
- Use proper timeframes: Daily and weekly charts provide more reliable levels than minute charts
- Wait for confirmation: Price action at Fibonacci levels matters more than the levels themselves
The Math Behind Market Waves
Like ancient navigators reading star patterns, traders have always searched for reliable guides through market chaos. Fibonacci retracement levels offer that guidance—mathematical lighthouses marking where price waves often pause, bounce, or reverse course.
Ancient Numbers Meet Modern Markets
The story starts in medieval Italy, though the mathematical roots stretch back to ancient Indian scholars around 200 BC. Leonardo of Pisa—better known as Fibonacci—introduced these patterns to European minds through his 1202 work Liber Abaci. But markets didn't adopt these numbers until the 1930s, when Ralph Nelson Elliott noticed something remarkable: stock prices moved in five-wave patterns during trends, followed by three corrective waves. The ocean had been following Fibonacci rhythms all along.
For traders learning to identify Elliott Wave patterns and ABC corrections, Fibonacci levels provide the mathematical framework that makes these patterns predictable. The two concepts work hand-in-hand—Elliott Waves show the structure, Fibonacci reveals the targets.
Calculating Your Wave Zones
Fibonacci Retracement Levels
Mathematical ratios derived from the Fibonacci sequence, used to identify potential support and resistance zones during price pullbacks. These levels act like reef breaks where market waves often change direction.
The math behind the magic is surprisingly simple. Pick two extreme points—a major high and low on your chart. The vertical distance becomes your measuring stick. For example, if Bitcoin surges from $50,000 to $100,000:
- 📊 23.6% retracement: $100,000 - ($50,000 × 0.236) = $88,200
- 📊 38.2% retracement: $100,000 - ($50,000 × 0.382) = $80,900
- 📊 50% retracement: $100,000 - ($50,000 × 0.5) = $75,000
- 📊 61.8% retracement: $100,000 - ($50,000 × 0.618) = $69,100
During uptrends, these levels become potential support zones where buyers might return. During downtrends, they flip into resistance zones where sellers often emerge.
The Five Essential Wave Markers
Each Fibonacci level tells its own story about market psychology:
The Shallow Pullback
When strong trends barely pause here, momentum stays fierce. Bulls or bears remain in complete control.
The Buy-the-Dip Zone
Smart money often accumulates around this level. The trend remains healthy with buyers stepping in early.
The Psychological Level
Not technically Fibonacci, but markets respect round numbers. Half-way retracements create strong psychological support.
The Golden Ratio
Most retracements that survive this level suggest trend continuation. The most watched level by professionals.
The Deep Retracement
Price reaching here often signals potential trend exhaustion. Watch for reversal patterns at this critical level.
Good news: modern platforms like WaveTrader translate these mathematical relationships into visual wave patterns. No complex calculations—just clear signals when price approaches these critical zones where market sentiment often shifts. Our Paddle Zone and Wipeout Zone indicators align perfectly with Fibonacci support and resistance levels.
Plotting Your Course: Drawing and Reading the Levels
 Image Source: Fidelity Investments
Drawing Fibonacci levels starts with finding the perfect wave—those moments when price makes its strongest moves up or down. Like choosing the right break to paddle out, selecting proper swing points determines whether your analysis catches the real momentum or gets wiped out by market noise.
Spotting the Perfect Swing Points
Swing High: The peak where price reversed after a strong upward move
Swing Low: The trough where price bounced after a significant decline
Focus on the big moves that made headlines, not every small ripple. Experienced wave readers stick to longer timeframes—daily or weekly charts reveal the ocean's true rhythm, while minute-by-minute charts show mostly chop. Your Fibonacci levels will only be as reliable as the swing points you choose. This is especially important when analyzing break signals and trading patterns in volatile crypto markets.
Drawing Your Retracement Lines
Here's your step-by-step paddle plan:
Identify the trend direction—are you riding an uptrend or downtrend?
For uptrends: Start at the swing low, drag to the swing high
For downtrends: Start at the swing high, drag to the swing low
Let the math work—your platform automatically plots the key levels: 23.6%, 38.2%, 50%, 61.8%, and 78.6%
WaveTrader cuts through this complexity, turning mathematical ratios into visual wave patterns you can read like surf conditions. Our automated tools identify swing points and draw Fibonacci levels instantly.
Reading the Retracement Story
Uptrend Retracements: Think of these levels as underwater reef shelves where buying pressure typically resurfaces. When price pulls back to the 38.2% level, it often signals the trend wants to continue its upward journey. The WaveTrader app highlights these as Paddle Zones—prime entry points for riding the next wave up.
Downtrend Retracements: These same levels become overhead resistance—ceiling zones where selling pressure often returns. Our Wipeout Zone indicators flash red when price approaches these danger areas.
The 61.8% golden ratio deserves special attention. Most retracements struggle to push beyond this level—it's where trends either regain their strength or admit defeat. Shallow pullbacks to 23.6% suggest powerful momentum, while deep dives to 78.6% often warn of potential trend shifts.
🏄 Bitcoin Wave Check: Current Market Analysis
Bitcoin currently holds above its 23.6% retracement at $89,459—bulls control the break as long as price stays above this zone. The next major support shelf sits at the 38.2% level ($77,126), while resistance waves crash around $100,000-$109,000. Upside targets include $118,000 (127.2% extension) and $131,000 (161.8% extension) for those riding the momentum.
For traders using beginner-friendly trading platforms, these levels provide clear reference points for setting entry and exit strategies without complex calculations.
Catching Real Waves: Fibonacci in Action
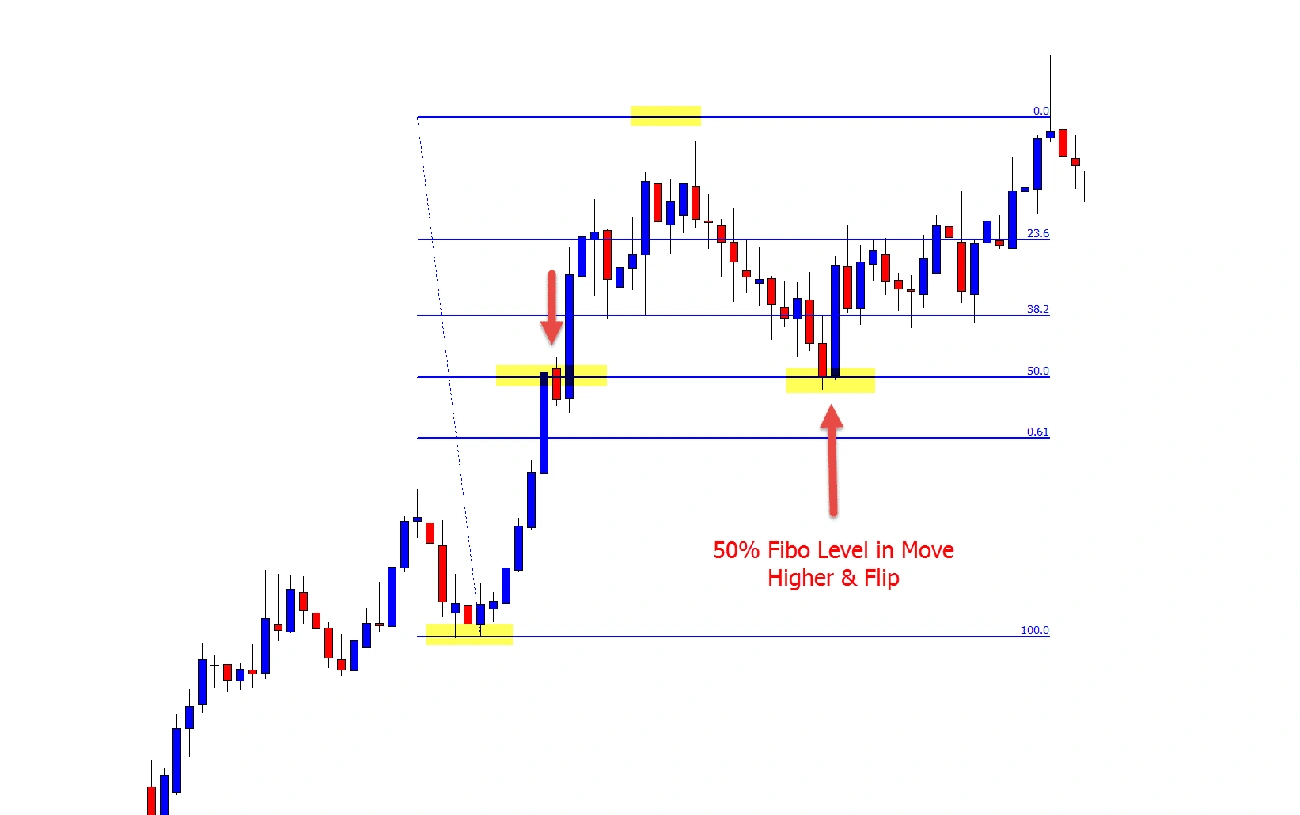 Image Source: Forex School Online
Reading wave patterns means nothing if you can't paddle into position when the perfect set arrives. Here's how to turn those mathematical levels into actual trading opportunities.
Timing Your Entry: The Paddle-In Strategy
Smart wave riders don't chase prices—they wait for the pullback. When an uptrend corrects to the 38.2%, 50%, or 61.8% levels, that's your cue to start paddling. These zones act like natural gathering spots where buyers return, drawn by the same mathematical psychology that moves crowds.
Wait for confirmation before you commit. A bullish engulfing candle at the golden ratio? That's your green light to paddle in. The WaveTrader app sends real-time alerts when price approaches these critical levels, complete with momentum indicators to confirm the setup.
Paddle Zone
WaveTrader's term for optimal entry zones where Fibonacci support levels align with bullish momentum. When multiple indicators converge at these mathematical levels, it signals high-probability buying opportunities—like finding the perfect spot to paddle into a wave.
Setting Your Safety Line: Stop-Loss Secrets
Never surf without a leash—and never trade without stops. Position your stop-loss just beyond the next Fibonacci level to give your trade room to breathe. If you enter at the 50% retracement, tuck your stop slightly below the 61.8% level. This cushion protects against normal market chop while keeping you safe from true reversals.
When choosing low-fee crypto exchanges for your Fibonacci trading, remember that tight spreads matter more at these precise mathematical levels where every pip counts.
Targeting Your Exit: Fibonacci Extensions
Extensions show you where the wave might peak. Target these key levels:
- 🎯 127.2% for quick profits—the first resistance beyond the previous high
- 🎯 161.8% for the main ride—the most reliable and commonly hit extension
- 🎯 261.8% when momentum screams higher—rare but powerful in strong trends
These targets work because countless traders and algorithms aim for identical spots, creating natural resistance zones. WaveTrader automatically calculates these extensions and displays them as visual wave peaks on your chart.
Power Combinations: Adding RSI and MACD
Fibonacci alone tells half the story. Combine a 61.8% retracement with oversold RSI and a bullish MACD crossover—now you've got a signal worth riding. Flip it around: Fibonacci resistance plus overbought RSI spells trouble ahead. These confirmations filter out false breaks that drain accounts.
The WaveTrader platform integrates these indicators seamlessly, highlighting when multiple signals align at Fibonacci levels. Our Signal Breaks dashboard shows you exactly when these confluences occur.
Real Example: Ethereum's Golden Bounce
Ethereum's move from $1,700 to $2,700 created a perfect teaching moment. The 61.8% retracement landed at $2,362—exactly where smart money started buying again. RSI showed oversold conditions, MACD crossed bullish, and volume spiked. Those who entered with stops at $2,200 (below the 78.6% level) rode the wave back to $2,700 and beyond.
WaveTrader's visual interface highlighted this setup without the math headache, showing market momentum as actual wave patterns you can surf. Our app turned complex calculations into a simple green Paddle Zone alert.
Advanced Wave Reading: Beyond Basic Fibonacci
Professional wave riders don't just watch one set—they read multiple swells converging at the same break. These advanced Fibonacci techniques separate weekend surfers from those who truly master the ocean's rhythm.
Stacking the Signals: Fibonacci Clusters
The magic happens when multiple Fibonacci levels from different price swings crash into the same zone. Picture three separate wave sets all breaking at the exact same reef—that's confluence, and it creates monster support or resistance.
True power emerges when Fibonacci levels align with moving averages, previous highs, or RSI oversold signals. You're not just betting on one indicator—you're stacking multiple reasons the market might turn at that exact spot. This is particularly powerful when combined with risk management strategies that protect your capital.
Reading Time as Well as Price
Most traders only watch where price might turn—but advanced wave readers also track when. Fibonacci time zones project vertical lines into the future based on the sequence: 21, 34, 55, 89, 144 days. These aren't crystal ball predictions, but they highlight dates when the market's natural rhythm often shifts.
Think of them as surf forecasts that tell you not just where the waves will break, but when the next big set rolls in. WaveTrader's advanced analytics combine time and price Fibonacci to spot high-probability turning points.
Visual Clarity Cuts Through the Math
WaveTrader strips away the spreadsheet complexity that buries most Fibonacci tools. The platform automatically highlights key retracement levels (38.2%, 50%, 61.8%) as visual wave patterns. No mental math—just clear signals when geometric relationships align for high-probability trades.
The Trend Wave feature flashes alerts when direction changes, turning mathematical relationships into intuitive surf reports you can read at a glance. Our Live Zones tracker shows you exactly where support and resistance cluster, making complex analysis simple.
Fibonacci Confluence
When multiple Fibonacci levels from different timeframes or price swings align at the same price zone. These confluence areas act like powerful magnets for price action—similar to how multiple wave sets create perfect surfing conditions when they converge.
Avoiding the Trap: When Fibonacci Becomes Fantasy
Here's the danger: forcing Fibonacci lines onto every chart until you see patterns that aren't really there. Confirmation bias turns useful tools into wishful thinking.
Smart wave riders wait for price action confirmation at Fibonacci levels. They combine these mathematical zones with momentum signals and remember that Fibonacci works partly because millions of traders watch the same levels, creating collective market psychology.
The strongest signals come when price, time, and momentum all point the same direction at a Fibonacci confluence zone. For those managing crypto taxes and tracking trades, these high-probability setups are worth documenting for your records.
🤔 Frequently Asked Questions
What are the most important Fibonacci retracement levels?
The key Fibonacci retracement levels are 23.6%, 38.2%, 50%, 61.8%, and 78.6%. The 61.8% level (golden ratio) is particularly significant as it often acts as strong support in uptrends or resistance in downtrends. The 38.2% and 50% levels are also widely watched by traders for potential reversal points.
How accurate are Fibonacci retracement levels?
Fibonacci levels work because millions of traders watch them, creating self-fulfilling prophecies. They're most reliable when combined with other indicators like RSI, MACD, or moving averages. Success rates improve significantly when multiple Fibonacci levels from different timeframes cluster in the same zone.
Should I use Fibonacci on daily or hourly charts?
Daily and weekly charts provide more reliable Fibonacci levels because they filter out market noise. Minute-by-minute charts show mostly chop and false signals. For swing trading, use 4-hour to daily charts. For position trading, weekly charts reveal the ocean's true rhythm.
Where should I place stop-losses with Fibonacci?
Place your stop-loss just beyond the next Fibonacci level from your entry. If entering at the 50% retracement, set your stop slightly below the 61.8% level. This gives your trade room to breathe through normal market chop while protecting against true reversals.
Can Fibonacci levels predict future price movements?
Fibonacci levels don't predict the future—they highlight probable reaction zones based on market psychology. They work best as confluence points where multiple technical factors align. Always wait for price action confirmation before entering trades at Fibonacci levels.
Catch Your Next Perfect Wave
You now hold the tools that separate confident traders from chart-watchers stuck on the shore. Fibonacci retracement levels aren't mystical—they're mathematical surf reports that reveal where market momentum shifts, pauses, or continues rolling.
The golden ratio at 61.8% carries special weight because millions of traders watch the same level. When price approaches these zones, buying and selling pressure naturally clusters, creating the very support and resistance patterns you've learned to spot. It's a shared language spoken across trading floors worldwide.
Combine these levels with RSI momentum signals or moving average trends, and you'll catch far more reliable waves. False breakouts become easier to avoid when multiple indicators point toward the same conclusion. The WaveTrader app brings all these tools together in one visual interface—no more jumping between charts and calculators.
WaveTrader takes these complex relationships and paints them as visual wave patterns on your screen. No more calculating percentages or second-guessing swing points—just clear entry zones and exit signals that make sense at first glance. Our Paddle Zones light up green at key Fibonacci support, while Wipeout Zones flash red at resistance levels.
The secret lies in practice. Start with paper trading or small positions while you develop your eye for these patterns. Soon you'll recognize how different assets respond to Fibonacci levels, building the intuitive sense that separates seasoned wave riders from weekend surfers.
Ready to put this knowledge to work? The markets are always generating new waves—and now you know how to read their hidden patterns. Download WaveTrader and transform mathematical complexity into visual simplicity. Join thousands of traders who've already discovered that riding market waves doesn't require a PhD in mathematics—just the right tools and a surfer's intuition.
Start your free trial today at WaveTrader.net and see how Fibonacci levels come alive as actual wave patterns you can surf. Because the best traders don't fight the ocean—they learn to read its rhythm and ride its waves. 🌊🏄♂️
Disclaimer: This article is for educational and informational purposes only. It does not constitute financial, investment, or trading advice. Cryptocurrency markets are volatile and carry significant risk. Past performance does not guarantee future results. Always do your own research and consider consulting a qualified financial advisor before making any investment decisions.