
Break Signals Made Easy: A Beginner's Guide to Crypto Trading Apps
 Captain Crypto
Break signals are your early warning system in crypto trading – they occur when prices decisively move beyond key support or resistance levels with significant volume, often marking the beginning of new trends. For beginners, these signals provide clear visual cues for when to enter or exit trades, especially when using intuitive apps like WaveTrader that transform complex patterns into surf-inspired visuals.
Key Takeaways
- • Break signals occur when cryptocurrency prices decisively move beyond support/resistance levels with high volume, marking potential trend changes
- • WaveTrader simplifies technical analysis using ocean-inspired visuals: blue "Up Swell" waves for bullish momentum, orange "Down Crash" for bearish pressure
- • Watch for volume spikes, key support/resistance levels, and wave formations to spot break signals before they happen and avoid false breakouts
- • Enter trades after confirmation, set stop-losses below broken levels, use trailing stops to protect gains, and avoid FOMO-driven overtrading
- • Practice with demo accounts first, combine break signals with other indicators, and focus on 2-3 complementary tools for better accuracy
The cryptocurrency market can be unpredictable for investors, with prices moving up, down, and sometimes experiencing dramatic swings. If you're looking for a beginner-friendly crypto app that helps make sense of these chaotic movements, understanding break signals could be your key to success. (If you're still learning the basics, our guide on Riding the Crypto Market Waves covers fundamental market analysis for beginners.) With daily trading volume around $112 billion, the crypto market is highly dynamic, requiring tools that simplify complex patterns into actionable insights.
Elliott Wave Theory, which predicts price movements in various markets, provides a foundation for recognizing patterns before major price shifts occur. However, as a beginner, analyzing these complex wave formations can feel overwhelming. This is where break signals shine – they function as your early warning system, alerting you when cryptocurrency prices are breaking through key levels with strong momentum. Over 15,000 businesses worldwide now accept Bitcoin as payment, blurring lines between traditional finance and crypto, yet many new traders still struggle to identify optimal entry and exit points.
In this guide, you'll learn how break signals work in crypto trading apps, how to spot them before they happen, and most importantly, how to use them to make more confident trading decisions. Whether you're trying to catch an upward trend or protect yourself from a downward crash, understanding these visual cues can transform how you navigate the crypto market in 2025 and beyond.
What is a Break Signal in Crypto Trading?
In crypto trading, spotting the right moment to enter or exit a market can make all the difference between profit and loss. Break signals represent these crucial moments, offering a clear indication that market dynamics are shifting.
Definition of a Break Signal
Break Signal
A break signal occurs when a cryptocurrency's price moves decisively beyond an established support or resistance level with significant trading volume. These signals indicate that buying or selling pressure has overcome a price barrier that previously contained the asset's movement.
Break signals are fundamental tools in technical analysis because they often mark the beginning of new price trends or significant volatility increases. Unlike minor price fluctuations, genuine break signals typically feature sudden price movements accompanied by higher-than-normal trading volumes. This combination of price action and increased market participation suggests that the momentum behind the move is substantial, making it more likely to continue in the direction of the break.
For instance, Bitcoin might trade below $40,000 for weeks, repeatedly touching this level without breaking through. Once sufficient buying pressure accumulates, the price might surge above $40,000 with heavy volume – creating a clear break signal that alerts traders to a potential new uptrend.
Breakout vs. Breakdown explained
Although sometimes used interchangeably, break signals come in two distinct forms: breakouts and breakdowns.
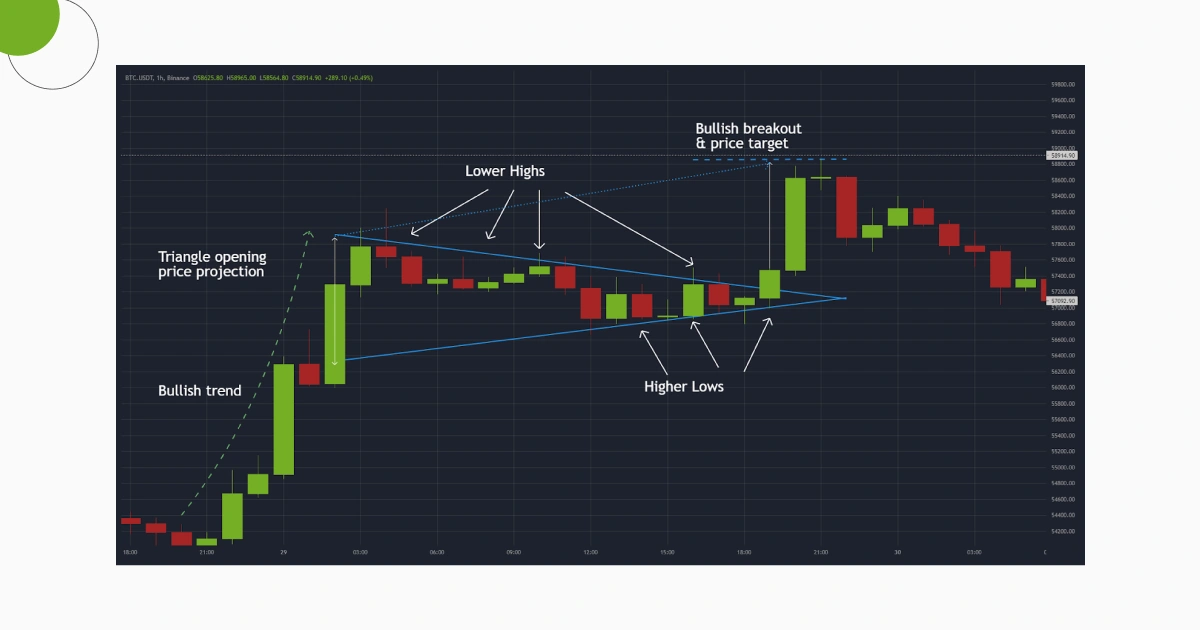
Bullish Breakout
A bullish breakout happens when price pushes above a resistance level that previously capped upward movement. This resistance level represents a price point where selling pressure typically overwhelmed buyers in the past.
When price finally breaks through this ceiling, it suggests buyers have gained control of the market. Breakouts often signify the start of upward trends and provide potential buying opportunities.
Bearish Breakdown
A bearish breakdown (also called a downward breakout) occurs when price falls below an established support level. The support level functions as a floor where buying interest previously prevented further price drops.
A decisive move below this level indicates that selling pressure has intensified, potentially triggering a new downward trend. During breakdowns, sellers dominate the market, creating opportunities for exit or short positions.
Both signals share these characteristics:
- Price movement beyond a defined level (resistance or support)
- Increased trading volume confirming the move's strength
- Potential for continued momentum in the break direction
- Signals for possible trend changes or accelerations
Furthermore, experienced traders look for confirmation after the initial break to avoid "fakeouts" – false signals where price temporarily breaks a level but quickly reverses. Confirmation might include sustained price action beyond the breakout point or technical indicators showing momentum continuation.
Why Break Signals matter for beginners
For newcomers to crypto trading, break signals offer several distinct advantages over more complex analysis methods.
Firstly, they provide clear, visual cues for market entries and exits. Rather than interpreting complicated chart patterns, beginners can focus on identifying when price crosses significant levels with volume. This simplicity reduces the learning curve while still offering effective trading opportunities.
Secondly, break signals help identify emerging trends early. Since these signals often mark the beginning of new price movements, they allow beginners to align their trading with the market's direction instead of fighting against it. Essentially, trading with the trend increases probability of success.
Thirdly, they create defined risk management parameters. After a breakout, the broken resistance often becomes new support (and vice versa for breakdowns). This phenomenon gives beginners natural places to set stop-loss orders, limiting potential losses if the market moves against them.
Additionally, beginner-friendly crypto apps now visualize these signals with intuitive interfaces. Rather than staring at candlestick charts hoping to notice breakouts, newer platforms highlight these moments with clear alerts and visual cues, making technical analysis more accessible to newcomers.
Learning to recognize and trade break signals provides beginners with a solid foundation in technical analysis. Although no signal guarantees success, understanding break signals helps new traders develop market awareness and discipline – critical skills for long-term trading success.
How Break Signals Work in WaveTrader
WaveTrader transforms complex crypto market data into an intuitive surfing experience, making technical analysis accessible even for newcomers to trading.
Visual cues: Up Swell and Down Crash
Up Swell
Blue waves that rise on your chart when prices gain upward momentum. As buying pressure increases, these waves grow taller and more pronounced, signaling strengthening bullish momentum.
Down Crash
Orange waves that tumble downward when selling pressure dominates. These visual cues provide immediate insight into market direction without requiring complex chart analysis.
The genius of this approach lies in its simplicity – as opposed to deciphering candlestick patterns or technical indicators, you can instantly grasp market sentiment through wave color and shape. Just as a surfer reads ocean waves, you'll quickly learn to interpret these digital swells as market signals.
Paddle Zones and Wipeout Zones
Paddle Zone
Green zones that highlight optimal buying opportunities – essentially support levels where prices might bounce upward. These zones act as visual buy signals, showing where smart traders typically enter positions.
Wipeout Zone
Red zones that mark potential selling areas or resistance levels where prices may reverse. These danger zones warn about potential downside risk, helping you avoid buying at unfavorable prices.
The platform's real-time zones tracker even shows percentage metrics like "68% In Paddle Zone" or "12% Wipeout Risk" to quantify the opportunity or danger.
How Wave Power (volume) is shown
Volume – the amount of trading activity – plays a crucial role in validating price movements. In traditional analysis, higher volume typically confirms the strength behind a price move. WaveTrader visualizes this concept through wave intensity.
Just as ocean waves grow more powerful with stronger currents, the platform's digital waves increase in size and intensity when trading volume spikes. Consequently, large, pronounced waves indicate significant market participation, while smaller waves suggest lighter trading activity. This intuitive representation helps you distinguish between meaningful market moves and potential false signals without studying volume charts.
How alerts are triggered
Perhaps the most valuable feature for beginners is WaveTrader's automated alert system. The platform's algorithms continuously analyze market patterns, price levels, and volume trends to detect potential break signals. Once identified, these opportunities trigger instant notifications, ensuring you never miss important market movements.
Specifically, alerts can fire when cryptocurrencies enter designated Paddle Zones or when Wipeout Signals are detected. Moreover, the platform's "home-made algorithm" tracks waves daily, eliminating the need to constantly monitor the app. This automated approach provides peace of mind – instead of obsessively checking charts, you can rely on timely notifications when genuine opportunities arise.
Through these intuitive visual elements, WaveTrader makes the complex world of technical analysis remarkably accessible, offering a beginner-friendly crypto app that speaks in waves rather than jargon.
How to Spot a Break Signal Before It Happens
Anticipating price movements before they happen separates successful traders from the rest. By learning to identify potential break signals early, you can position yourself ahead of major market moves.
1. Watch for volume spikes
Volume serves as a critical confirmation element for any significant price movement. Sudden spikes in trading volume typically signal major events impacting the market. These spikes often accompany substantial price shifts and can either validate or contradict existing trends. In WaveTrader, volume appears as "Wave Power" – larger, more pronounced waves indicate higher trading activity. When volume increases simultaneously with price approaching a key level, a breakout becomes much more likely. Generally, legitimate breakouts should feature noticeable volume increases – if volume remains low despite price movement, be cautious as this could indicate a false signal.
2. Identify key support and resistance levels
Support and Resistance
Support occurs where downward price movement typically pauses due to concentrated buying interest. Conversely, resistance emerges where upward momentum slows because of increased selling pressure. These levels create natural barriers where break signals commonly appear.
In WaveTrader, these manifest as green "Paddle Zones" (support) and red "Wipeout Zones" (resistance). When price approaches these zones with momentum, pay close attention – a break signal may trigger if the barrier is breached.
3. Recognize wave shapes forming
Elliott Wave Theory helps traders understand market movements through predictable wave patterns. According to this theory, markets move in cycles of impulsive waves (with the trend) and corrective waves (against the trend). By identifying these wave formations early, you can anticipate potential reversal points where break signals might occur. WaveTrader visualizes these patterns through colored waves – blue "Up Swell" waves for bullish momentum and orange "Down Crash" waves for bearish pressure.
4. Use Paddle Zones as early indicators
Green Paddle Zones highlight optimal buying opportunities where prices traditionally bounce upward. These zones act as visual buy signals, indicating where support typically forms. Similarly, watching price action as it approaches these zones can provide early warning of potential break signals. A strengthening Up Swell wave entering a Paddle Zone suggests increasing bullish momentum that might trigger an upward break signal.
5. Avoiding false breakouts
False Breakout
False breakouts occur when price briefly moves beyond key support or resistance levels but subsequently reverses direction. These "fakeouts" can trap traders who act too quickly without waiting for confirmation.
To avoid these traps, look for confirmation before acting. A genuine breakout should feature increasing volume and sustained price movement beyond the breakout point. Additionally, watching for candlestick patterns after the initial break can help verify its validity. In WaveTrader, confirmed break signals generally display larger waves with sustained momentum, unlike the smaller, short-lived waves that characterize false breakouts.
How to Trade Using Break Signals
Once you've identified a break signal, executing your trades strategically becomes crucial for success.
When to enter a trade
Timing matters enormously with break signals. Enter a bullish position when prices close decisively above resistance levels, or take bearish positions when prices break below support. Nevertheless, always wait for confirmation—look for above-average volume accompanying the breakout to distinguish real opportunities from fakeouts. Ideally, wait until a retest of the broken level confirms the new support/resistance has formed before entering.
Setting stop-losses correctly
Place your stop-loss just below the broken resistance level (for bullish trades) or above the broken support (for bearish trades). This logical placement protects your position while giving price room to retest previous levels. Remember, after a breakout, old resistance typically becomes new support, creating a natural barrier for your stop placement.
Taking profits with confidence
Set clear profit targets before entering any trade. Calculate reasonable objectives based on recent price behavior or average past price swings. Consider using multiple take-profit levels to scale out gradually—taking partial profits at the first target, then adjusting stops to breakeven for remaining position.
Using trailing stops
Trailing Stop
Trailing stops automatically follow profitable price movements while protecting gains. They move only in your favor, maintaining a fixed distance as price improves but staying fixed if price reverses.
This powerful tool eliminates emotion when exiting trades. Choose between percentage-based, dollar-amount, or volatility-based (ATR) trailing stops depending on market conditions.
Avoiding FOMO and overtrading
FOMO (Fear Of Missing Out) leads to buying at non-optimal prices without proper analysis. Combat this by conducting independent research before acting on break signals. Develop a clear trading plan with predefined entry/exit rules. Focus on long-term perspective rather than worrying about missing individual trades. Remember, the crypto market produces endless opportunities—you don't need to chase every signal.
Beginner Tips for Using Crypto Trading Apps
Starting your crypto journey requires the right tools to navigate market volatility. Following practical guidelines ensures you build confidence without risking real money.
Choosing a beginner friendly crypto app
Look for platforms with clean interfaces and educational resources. Coinbase stands out as beginner-friendly with its simple design and learning materials. Alternatively, eToro offers a social community where you can follow experienced traders and discuss strategies. In reality, the best app depends on your specific needs – whether that's cryptocurrency variety, low fees, or charting tools.
Setting up alerts and notifications
Price alerts prevent missing important market movements. To enable them, navigate to your app's alert section (often marked by a bell icon) where you can set targets for specific cryptocurrencies. On most platforms, you can choose between "Price rises above" or "Price drops below" options. Afterward, ensure notifications are enabled in both your browser and system settings.
Practicing with demo accounts
Virtual portfolios allow risk-free experimentation before investing actual funds. eToro provides $100,000 in virtual currency, as does MEXC. Indeed, these demo environments replicate real market conditions, letting you test strategies and gain confidence.
Combining Break Signals with other indicators
To enhance Break Signal accuracy, pair them with complementary indicators. Experts recommend using 2-3 indicators to balance clarity and confirmation. (For a deeper dive into technical indicators, check out our guide: Crypto Trading Analytics Made Simple.) Effective combinations include:
- Trend indicators (moving averages) with momentum indicators (RSI)
- Volatility indicators (Bollinger Bands) with volume analysis
Conclusion
Break signals serve as your early warning system in the unpredictable world of cryptocurrency trading. Throughout this guide, you've learned how these crucial indicators mark decisive price movements beyond established support and resistance levels. Furthermore, you now understand the difference between bullish breakouts and bearish breakdowns, both essential concepts for making informed trading decisions.
WaveTrader transforms this complex technical analysis into an intuitive surf-inspired experience. Blue "Up Swell" waves and orange "Down Crash" waves visualize market momentum, while green "Paddle Zones" and red "Wipeout Zones" highlight optimal entry and danger points. This visual approach makes break signals immediately understandable, even without extensive chart analysis experience.
Spotting break signals before they happen requires attention to volume spikes, key support and resistance levels, and wave formations. Additionally, practicing with demo accounts allows risk-free experimentation before committing real funds. Remember, false breakouts happen frequently, so confirmation through sustained price movement and increased volume remains critical for validation.
Trading with break signals demands disciplined execution. Wait for confirmation, set strategic stop-losses just below broken levels, take profits at predetermined targets, and consider trailing stops to protect gains while allowing trends to develop. Above all, guard against FOMO and overtrading – the market produces endless opportunities, making patience your valuable ally.
Break signals ultimately simplify the complex world of technical analysis, giving you clear visual cues for market entries and exits. Rather than drowning in candlestick patterns and indicators, you can ride the market's waves with greater confidence. Just like a skilled surfer reads ocean swells, you'll learn to interpret digital waves as meaningful market signals. Start small, practice consistently, and soon you'll navigate the crypto market's ups and downs with the composure of a seasoned trader catching the perfect wave.
Expand Your Trading Knowledge
Ready to deepen your understanding? Explore these related guides:
❓ Frequently Asked Questions
Q1. What are break signals in cryptocurrency trading?
Break signals are indicators that occur when a cryptocurrency's price moves decisively beyond established support or resistance levels with significant trading volume. They often mark the beginning of new price trends or significant volatility increases, providing clear visual cues for potential market entries and exits.
Q2. How does WaveTrader visualize break signals?
WaveTrader uses ocean-inspired visuals to represent market movements. Blue "Up Swell" waves indicate bullish momentum, while orange "Down Crash" waves show bearish pressure. Green "Paddle Zones" highlight potential support levels, and red "Wipeout Zones" mark resistance areas. These intuitive visuals make it easier for beginners to interpret market signals.
Q3. What should I look for to spot a break signal before it happens?
To anticipate break signals, watch for volume spikes, identify key support and resistance levels, recognize wave shapes forming, and use Paddle Zones as early indicators. It's also crucial to learn how to distinguish between genuine breakouts and false signals by looking for confirmation through sustained price movement and increased trading volume.
Q4. How should I set stop-losses when trading with break signals?
When trading with break signals, place your stop-loss just below the broken resistance level for bullish trades or above the broken support for bearish trades. This placement protects your position while allowing room for price to retest previous levels. Remember that after a breakout, old resistance often becomes new support, creating a natural barrier for stop-loss placement.
Q5. What are some beginner-friendly tips for using crypto trading apps?
For beginners, it's advisable to choose user-friendly apps with educational resources, set up price alerts to stay informed about market movements, practice with demo accounts before risking real money, and combine break signals with 2-3 complementary indicators for better accuracy. It's also important to develop a clear trading plan and avoid overtrading due to FOMO (fear of missing out).
References
[1] - https://atas.net/technical-analysis/wave-analysis-and-volume-analysis/
[2] - https://www.investopedia.com/terms/t/trailingstop.asp
[3] - https://www.p100.io/blog/understanding-trading-volume-in-crypto
[4] - https://www.investopedia.com/deal-with-crypto-fomo-6455103
[5] - https://www.investopedia.com/articles/trading/08/trading-breakouts.asp
[6] - https://help.crypto.com/en/articles/11026916-crypto-com-exchange-price-alerts
[7] - https://www.osl.com/hk-en/academy/article/how-to-use-volume-in-crypto-trading
[8] - https://wavetrader.net/
[9] - https://www.cryptohopper.com/blog/best-indicators-for-identifying-crypto-breakouts-11373
[10] - https://www.investopedia.com/trading/support-and-resistance-basics/
[11] - https://trustwallet.com/blog/cryptocurrency/what-are-support-and-resistance-in-crypto
[12] - https://osl.com/academy/article/demystifying-price-charts-with-elliott-wave-theory/
[13] - https://www.ig.com/en-ch/trading-strategies/what-is-a-false-breakout-and-how-can-you-avoid-it--230424
[14] - https://www.xs.com/en/blog/break-of-structure/
[15] - https://academy.tradetomato.com/overcoming-fomo-fear-of-missing-out-in-crypto-trading-how-to-stay-disciplined-418e427f4b5c
[16] - https://money.com/5-best-crypto-trading-apps/
[17] - https://www.hollaex.com/blog/five-best-crypto-demo-accounts-to-practice-trading
[18] - https://www.etoro.com/en-us/trading/demo-account/
[19] - https://www.altrady.com/blog/crypto-trading-strategies/combine-multiple-indicators
Disclaimer: This article is for educational and informational purposes only. It does not constitute financial, investment, or trading advice. Cryptocurrency markets are volatile and carry significant risk. Past performance does not guarantee future results. Always do your own research and consider consulting a qualified financial advisor before making any investment decisions.
Ready to Ride?
The waves are rising and the water's warm. Grab your digital board and start riding the market waves today.
Download WaveTrader free on the App Store and turn complex crypto analytics into a breezy day at the beach.
Download on the App Store →Share this wave:
Captain Crypto
Surf instructor turned crypto educator. Helping learners ride the market waves with confidence.
Catch the Next Wave

Why Most Traders Pick the Wrong Stock Entry Point (And How to Fix It)
Discover why 90% of retail traders crash on entry timing and learn institutional strategies to find high-probability stock entry points. Master killzones, breakout-retest setups, and overcome the psychology that sinks accounts.

The Secret Swing Trading Pattern That Made Me $50K in Crypto
Discover the exact swing trading pattern that generated $50K in a single Bitcoin trade. Learn the indicators, timing, and risk management strategies that work in both bull and bear markets.

Riding the Crypto Market Waves: A Beginner's Guide to Market Analysis
If you're new to cryptocurrency trading, the charts and data can feel intimidating at first. Learn how to understand market analysis with visual tools and surf analogies.