Quick Answer
Two years of systematic crypto trading revealed that visual pattern recognition outperforms complex indicators. The winning formula: RSI + Bollinger Bands on 4-hour timeframes, combined with visual trading tools that show market momentum as waves. Success came from strict risk management (1-2% per trade), patience over speed, and treating crypto as property not currency. Professional traders average $1.5M daily profits, but 70% of retail traders lose money chasing hype without proper analysis.
Listen to This Article
Podcast Episode • 15 min
Bitcoin crests near record highs of $122,000, yet daily profits stay surprisingly calm at under $750 million—well below the January and July tsunami of $2 billion. This restrained profit-taking caught my attention during two years of studying how crypto markets actually behave—like watching surfers hold back when the waves look perfect but feel wrong.
The crypto ocean reveals patterns that contradict what most people believe. Professional wave riders generate steady profits—averaging $1,525,752 daily from bitcoin trading over four years. But catching these swells takes more than luck or perfect timing. The best approach combines technical analysis with hands-on practice, especially as AI-powered prediction tools reshape how we read market movements.
My journey analyzing crypto charts led to a breakthrough: visual trading tools made complex patterns as readable as ocean swells. Like a surfer watching for the perfect wave, market momentum became intuitive when presented visually—a shift that changed everything about my trading approach. The WaveTrader app exemplifies this philosophy, turning abstract numbers into surfable patterns that even beginners can understand.
My experimental system caught a 62% total return with roughly 16.05% annual gains, though I weathered a 15.67% maximum drawdown when market storms hit. Here's what really works, what wipes you out, and how visual pattern recognition can help you ride crypto waves more effectively than staring at traditional charts all day.
🔑 Key Takeaways
- Visual beats mathematical: Pattern recognition through visual tools outperformed complex indicator calculations
- 4-hour timeframe is golden: This timeframe delivered the cleanest signals for swing trading
- RSI + Bollinger Bands combo works: This pairing consistently delivered when both indicators aligned
- Risk management is non-negotiable: Never risk more than 1-2% per trade, no exceptions
- Patience beats speed: HODLing through volatility often outperformed frequent trading
Why I Started Studying Cryptocurrency Trading
The initial curiosity and motivation
My interest in cryptocurrency wasn't sparked by get-rich-quick dreams but by genuine intellectual curiosity. Bitcoin's historic break above $100,000 in December 2024—doubling from $50,000 earlier that year—captivated me. This remarkable volatility presented both opportunity and mystery worth investigating, like discovering a new surf break with waves unlike anything you've seen before.
Unlike newcomers drawn solely by profit potential, my motivation stemmed from deeper factors. Research shows cryptocurrency investment behaviors are influenced by psychological constructs including self-efficacy (belief in one's capabilities) and risk preference. Intrinsic motivation thrives when fueled by intellectual challenges and fascination with innovative realms.
What truly compelled me to dive deeper? Recognizing that cryptocurrency isn't just price action—it represents a fundamental shift in how we perceive money. I wanted to understand this phenomenon beyond headlines and hype, much like how visual analytics tools help traders see beyond the numbers.
What I hoped to learn
Before risking significant resources, I needed comprehensive knowledge of cryptocurrency's mechanics and market behavior. My learning objectives included:
Technical Understanding
Grasping blockchain fundamentals, mining processes, and market capitalization calculations
Risk Management
Learning to limit crypto investments to no more than 5% of my portfolio to prevent wild swings
Trading Psychology
Understanding how emotions influence investment decisions and identifying market psychology patterns
Practical Application
Developing skills to analyze cryptocurrency charts and spot visual patterns in price movements
I was particularly interested in whether cryptocurrency deserved a place in modern portfolios. Financial experts note that your first investment's most valuable return isn't profit—it's experience watching how crypto markets behave.
Setting up a structured study plan
Given cryptocurrency's complexity and volatility, random exploration wouldn't cut it. I developed a methodical approach to studying crypto trading, similar to how surfers study wave patterns and tide charts before committing to a new break.
First, I determined whether I wanted to be a long-term investor or active trader. Research indicates that for most people, a patient, long-term approach works better and creates less stress than watching charts all day—like choosing to surf only when conditions are perfect rather than paddling out in every swell.
Next, I allocated a modest learning budget. Financial advisors recommend starting small while learning—even $100 provides valuable experience. I followed expert advice to ensure my financial foundation was solid first: emergency fund established, retirement contributions flowing, and low-cost index funds already in my portfolio.
The breakthrough came after discovering visual trading tools that changed how I analyzed market data. Traditional charts seemed intimidating, but WaveTrader presented market movements as surfable patterns—suddenly making recognition intuitive rather than technical. This visual approach allowed me to "read" market momentum naturally, identifying break signals and entry points with clarity.
Visual Trading
A trading approach that converts complex market data into intuitive visual patterns, making price movements and momentum as easy to read as ocean swells. Instead of analyzing numbers and formulas, traders can see market psychology displayed as waves, zones, and patterns.
For data collection, I developed detailed tracking systems recording not just prices and trades but also my emotional state and decision-making processes. This systematic documentation proved invaluable for identifying both successful patterns and psychological pitfalls.
Finally, I established clear learning milestones rather than profit targets. This perspective shift freed me from immediate return pressure and allowed focus on skill development—ultimately leading to much better results than chasing quick gains.
First Six Months: Paddling Out
My first real challenge was staring down crypto's notorious volatility—prices that could double or crash by half within hours. This wasn't just market movement; it was financial whiplash that could make or break you before lunch, like getting caught in the impact zone when a set comes through unexpectedly.
Making sense of the chaos
Crypto volatility hits different than traditional markets. Without physical assets or central bank backstops, these markets move on pure momentum and emotion. Even the fees can shock you—sometimes 5% or higher just to trade Bitcoin, while stock trading costs keep dropping. That's why choosing low-fee exchanges becomes crucial for active traders.
What drives these wild swings?
- 🔥 Raw emotion: Fear and greed move prices faster than fundamentals. One tweet can trigger avalanches
- 🔥 Thin markets: Smaller trading volumes mean bigger price jumps with less money
- 🔥 Tech disruption: New blockchain updates or project launches shake everything up
- 🔥 Minimal oversight: Limited regulation leaves room for manipulation
The upside? This same volatility creates the profit opportunities that draw traders from traditional markets. You just need to learn how to read the signals before they hit—like spotting the telltale signs of an incoming set.
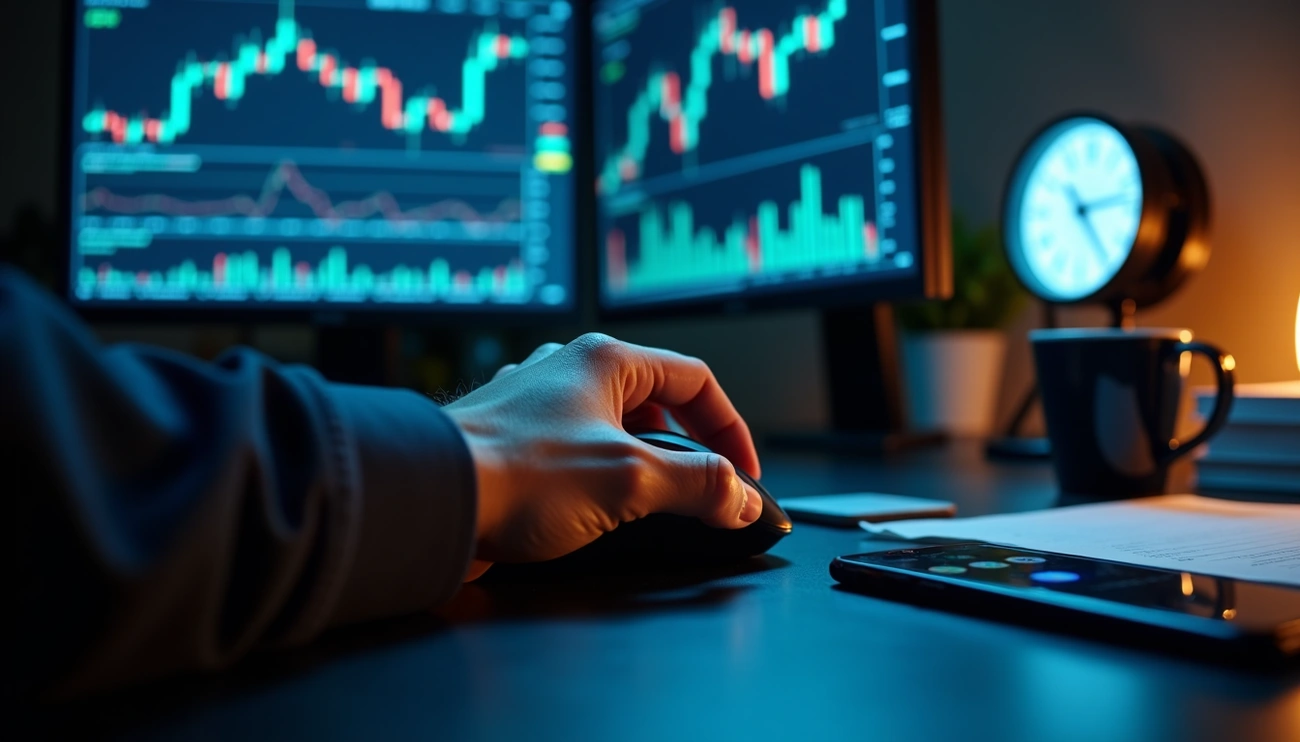
Decoding the charts
Candlestick charts became my primary compass through crypto's chaos. These visual snapshots show four key prices—open, close, high, low—within any timeframe you choose. Understanding these patterns is essential, whether you're using Fibonacci retracements or simpler trend analysis.
Green candles meant prices climbed. Red candles showed decline. Simple enough. But the real insights came from the "wicks"—those thin lines extending from candle bodies. A long bottom wick often signaled buyers stepping in as prices dropped, hinting at potential rebounds—like seeing the water pull back before a wave builds.
I dove deeper into technical indicators: moving averages for trend direction, RSI for momentum, Bollinger Bands for volatility. My analysis checklist grew: identify the trend, mark support and resistance levels, confirm signals with multiple indicators.
The breakthrough came through WaveTrader's visual approach. Instead of wrestling with mathematical formulas, I could see market momentum as actual waves—suddenly making pattern recognition feel as natural as watching ocean swells. The app's "Paddle Zones" (buy signals) and "Wipeout Zones" (sell signals) transformed abstract concepts into actionable intelligence.
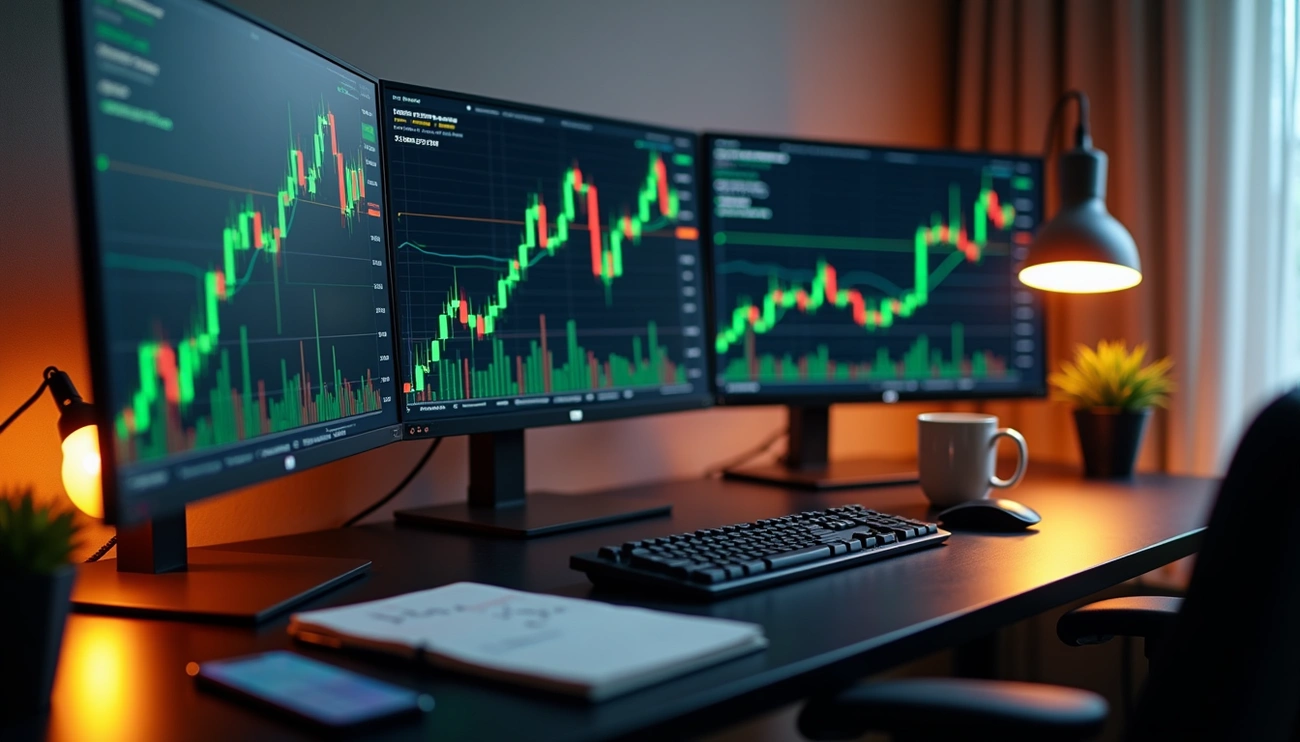
Building my toolkit
Platform selection proved crucial. TradingView became my charting headquarters with its extensive indicator library and customization options. For actual trading, I evaluated exchanges based on security, fees, and features.
Security concerns hit home after learning about exchange vulnerabilities despite blockchain's inherent safety. Customer service quality also lagged behind traditional brokerages—many crypto exchanges still don't offer direct phone support.
CoinGecko provided comprehensive market data—prices, market caps, trading volumes across hundreds of cryptocurrencies. These analytical tools helped me make decisions based on actual data rather than social media hype.
Through careful platform choices and dedicated chart study, I slowly developed the ability to spot potential trades while keeping risks manageable—skills that would prove essential as my crypto education deepened.
Building My Trading System from the Ground Up
Once the fundamentals clicked, I faced a bigger challenge: creating a trading system that actually worked. Copying someone else's approach felt like wearing ill-fitting surf gear—you need something built for your style and risk tolerance.
The Indicator Testing Phase
My technical analysis journey started with the classics. Moving Averages became my first focus—these smoothed out price noise to reveal underlying trends while filtering short-term chaos. Simple Moving Averages (SMAs) helped me spot long-term directions, while Exponential Moving Averages (EMAs) responded faster to recent price changes, catching momentum shifts quicker.
The Relative Strength Index (RSI) earned its place next. This momentum gauge revealed when cryptocurrencies hit overbought territory (above 70) or oversold conditions (below 30)—often signaling potential reversals worth watching. It's like spotting when a wave is about to break—the energy builds until it has nowhere to go but down.
MACD (Moving Average Convergence Divergence) rounded out my core trio. This indicator tracked both trend strength and direction changes. The MACD histogram became particularly valuable, showing momentum shifts through the visual relationship between its main line and signal line.
Bollinger Bands proved exceptional for measuring crypto's wild volatility. These consisted of:
- 📊 A simple moving average (middle band)
- 📊 Two standard deviation lines above and below
The bands identified reversal zones—prices hitting the upper band often meant overbought conditions, while approaches to the lower band suggested potential buying opportunities.
Visual Analysis: The Game Changer
Traditional indicators delivered results, but they created a new problem: analysis paralysis. Quick decisions became impossible when juggling multiple oscillators and moving averages during crypto's lightning-fast movements.
The solution came from recognizing how my brain actually processed information. Research shows professional crypto traders use visual tools to spot opportunities faster and understand their implications without cognitive overload. Numbers required interpretation; patterns just clicked.
Visual trading methods transformed complex market data into recognizable shapes I could read instantly. This approach suited crypto's volatile nature perfectly—when prices move in seconds, you need split-second pattern recognition, not mathematical calculations.
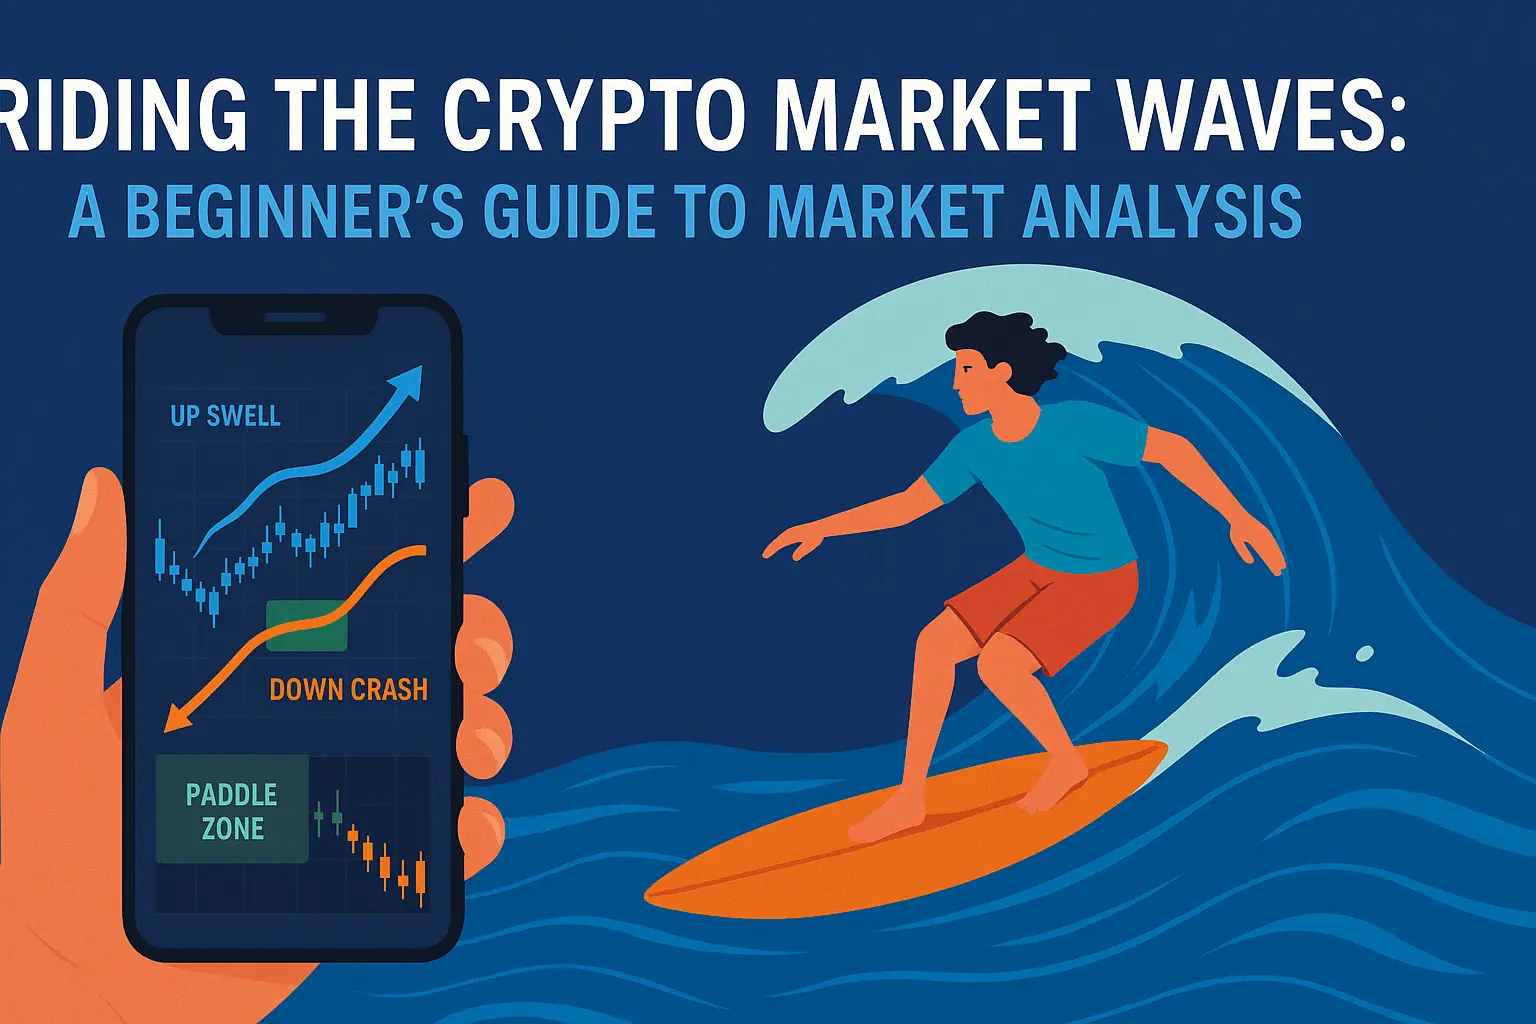
WaveTrader: Simplifying the Complex
My biggest breakthrough arrived with WaveTrader, a visual crypto platform built specifically for pattern recognition. Traditional charts showed candlesticks and lines; WaveTrader showed market psychology as actual wave movements.
The system displayed upward momentum as blue "Up Swell" waves and downward pressure as orange "Down Crash" waves—making trend identification immediate. Green "Paddle Zones" marked entry opportunities while red "Wipeout Zones" flagged exit signals. This intuitive approach helped me understand market movements the way I understand ocean swells—through visual pattern recognition rather than abstract calculations.
The platform's real power lay in automation. Its algorithms monitored over 500 symbols across multiple timeframes, identifying 15 distinct wave patterns that preceded significant moves. This eliminated the need for constant chart watching while ensuring no major opportunities slipped past—like having a friend text you when the surf's up at your favorite break.
Backtesting
Testing a trading strategy against historical market data to see how it would have performed in the past. Like studying video footage of previous surf sessions to improve your technique, backtesting helps identify which strategies work before risking real money.
Visual trading rebuilt my entire approach. Instead of wrestling with indicator calculations, I learned to read market sentiment like weather patterns. Abstract technical concepts became as intuitive as spotting storm clouds—proving that sometimes the simplest visual systems outperform the most sophisticated mathematical formulas.
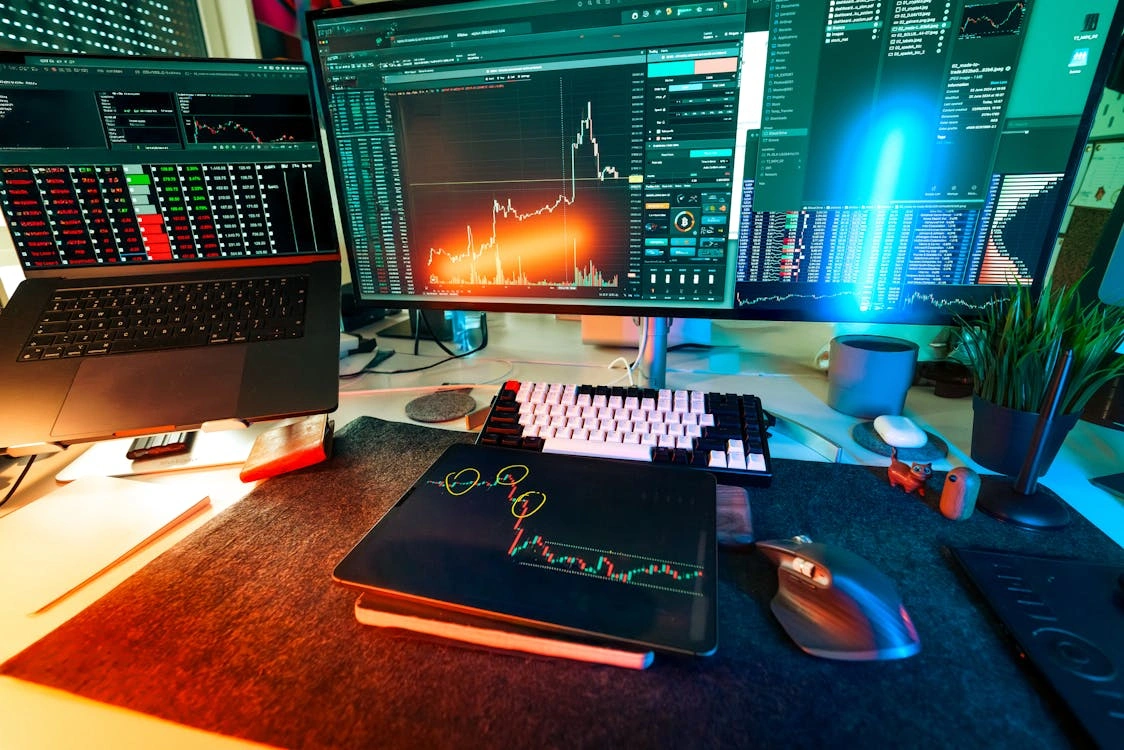
Catching the Perfect Swells: What Actually Worked
 Image Source: Good Crypto
Months of testing revealed which strategies catch real waves versus which just create foam. My data exposed market patterns that flip conventional trading wisdom on its head.
Reading Different Ocean Conditions
Trend-following and mean-reversion aren't rival approaches—they're tools for different surf conditions. Trend-following catches those massive outlier swells with positive skew distributions, though win rates stay below 50%. Mean-reversion strategies grab quick wins, delivering 60-70% success rates but smaller gains.
Mean Reversion
A trading strategy based on the idea that prices tend to return to their average over time. Like waves that pull back before surging forward again, extreme price movements often correct back toward the mean, creating trading opportunities.
Crypto markets showed me distinct personalities for each approach. Short timeframes (10-20 days) favored mean-reversion, especially when Bitcoin hit local depths. But during strong uptrends, "riding the band" along Bollinger Bands' upper limits generated serious gains.
WaveTrader's visual patterns made these market moods obvious. Some days the crypto ocean formed perfect surfable waves—ideal for trend riding. Other times choppy conditions called for quick paddle-ins and fast exits. The app's wave visualizations helped me recognize these conditions instantly, turning market analysis into something as natural as reading the surf report.
The RSI-Bollinger Combo That Changed Everything
Testing dozens of indicators, one pairing consistently delivered: RSI plus Bollinger Bands. This double-confirmation system works like having two surf forecasts—RSI spots overbought/oversold zones while Bollinger Bands highlight price extremes against recent volatility.
My winning setup:
RSI Signal
Above 70 (overbought) or below 30 (oversold)
Bollinger Touch
Price touching band edges (2 standard deviations)
Entry Trigger
Enter only when both indicators align
This combo slashed false signals that wreck most technical strategies. Sure, even reliable setups occasionally misfire during market storms. But WaveTrader's visual waves made spotting high-probability opportunities feel like second nature rather than mathematical guesswork.
Why Backtesting Separates Dreamers from Wave Riders
Backtesting became my reality check—the difference between profitable strategies and expensive fantasies. Testing against historical data revealed how strategies would have performed across different market cycles.
The trap? Overfitting. Early on, I crafted strategies that looked perfect on historical charts but crashed in live markets. Backtesting works best as a filter to eliminate weak approaches, not as a crystal ball for future profits.
Both automated and manual backtesting earned their place. Automated tools crunched massive datasets quickly. Manual testing (paper trading) taught me the psychology of executing strategies when real money was at stake.
Here's what surprised me: seemingly contradictory research about indicator effectiveness actually made sense. One study showed indicators performing no better than random, while others proved Bollinger Bands and RSI beat buy-and-hold. Different market conditions, different results—not contradictions. It's like how the same surf break can be perfect at high tide but unsurfable at low tide.
WaveTrader's visual approach revealed patterns in backtest data that raw numbers couldn't show, turning statistical analysis into readable wave formations. This made it easy to spot which strategies worked in trending markets versus ranging markets, helping me adapt my approach to current conditions.
What Wiped Me Out: Costly Lessons from the Deep End
My crypto journey wasn't all perfect rides—several spectacular wipeouts taught me more than any successful trade. These painful mistakes revealed what not to do when you're learning to read market waves.
Overfitting models to past data
The biggest wipeout came from overfitting—crafting strategies that worked perfectly on old data but crumbled in live waters. This happens when you mistake random market noise for meaningful patterns. My backtests looked flawless, yet real trading felt like paddling into a storm.
Each new parameter I added made my system more complex and fragile. Soon I had "black box" strategies that even I couldn't understand. The wake-up call? A strategy that crushed it with a 20-period EMA would completely fail with a 22-period EMA. That kind of instability screams trouble—like a surfboard that only works on one specific wave height.
The fix came through simplification. I split historical data into training (80%) and testing (20%) chunks to see if strategies actually worked on fresh data. Fewer parameters, clearer principles. WaveTrader's visual approach saved me here—instead of drowning in optimization settings, I could focus on reading wave patterns intuitively.
Chasing hype and news cycles
Another expensive lesson: following crypto hype instead of market reality. The speculative nature often disconnects price moves from actual value, while social media amplifies both greed and panic.
FOMO hit me hard—buying coins at peak prices just because they were trending. Those "100x returns" headlines clouded my judgment, pushing me toward emotional trades instead of data-based decisions. It's like paddling for a wave just because everyone else is going, even when you know the section will close out.
The sobering truth? Over 70% of traders lose money chasing trends without proper analysis. Most major price moves come from viral momentum rather than genuine fundamentals, making news-driven trading a dangerous game.
I learned to ignore social media "experts" and trust my own research instead. WaveTrader's visual patterns helped me spot real momentum versus temporary hype—the difference between catching genuine swells and getting tumbled by fake waves. When you're starting your crypto journey, this distinction becomes crucial for survival.
Ignoring risk management early on
The most dangerous mistake was terrible risk management—risking way too much per trade instead of keeping position sizes under 1-3% of total capital.
My early errors included:
- ⚠️ Throwing too much money at crypto without keeping reserves for volatility
- ⚠️ Skipping stop-losses and profit targets, leaving positions exposed to sudden crashes
- ⚠️ Trading on impulse and emotion instead of following a disciplined plan
- ⚠️ Using excessive leverage that amplified both wins and devastating losses
Risk Management
The practice of identifying, assessing, and controlling threats to your trading capital. In crypto, this means setting position sizes, stop-losses, and never risking more than you can afford to lose. Like checking conditions before paddling out, proper risk management keeps you surfing another day.
Proper risk management changed everything. Small position sizes and adequate margins protected me from crypto's wild swings. This disciplined approach meant surviving losing streaks without emptying my account.
Crypto isn't a get-rich-quick scheme—it's a skill requiring proper execution, planning, and risk management. Even profitable traders can lose everything in two bad trades without proper risk controls. The WaveTrader app helps here by clearly marking "Wipeout Zones" where risk increases, helping traders avoid dangerous positions before they become costly mistakes.
Catching My First Real Wave: The Breakthrough Moment
The breakthrough in my crypto journey hit like spotting the perfect wave after hours of watching messy chop. Three key shifts transformed my inconsistent paddling into confident wave riding.
Building My Surf Code: Entry and Exit Rules
Months of getting tumbled by the markets taught me one truth: you need a clear set of rules, not gut feelings, to catch waves consistently. I developed what I called my "surf code"—specific criteria for paddling into positions and knowing exactly when to kick out.
My framework became rock-solid:
- 🏄 Pre-set stop-losses: Like knowing where the rocks are before you paddle out
- 🏄 Take-profit targets: Locking in gains before the wave crashes on shore
- 🏄 Risk-reward ratios: Only paddling for waves worth the energy
- 🏄 Scale trading: Entering positions in chunks rather than going all-in
Scale trading changed everything. Instead of betting it all on one wave, I'd paddle into positions gradually—catching better average entry points across multiple swells. Same with exits: I'd take 25% profits at my first target, another 25% at the second, then read the ocean for what came next.
Reading Wave Patterns Like a Local
Even with solid rules, my timing still felt off until visual pattern recognition clicked. Elliott Wave theory opened my eyes—suddenly I could see that markets move like actual ocean swells, following emotional rhythms rather than pure math.
Every wave tells a story of crowd psychology. The first push up reflects early optimism, the peak shows euphoria, then fear and panic crash everything back down. WaveTrader made these abstract patterns as clear as watching sets roll in from the horizon.
The app's blue "Up Swell" waves and orange "Down Crash" animations let me spot momentum shifts instantly. No more juggling five different indicators—I could see market sentiment flowing like water. These visual cues work especially well with chart patterns that traditional analysis might miss.
Those "bungee" indicators became my secret weapon for timing. They'd stretch tight before major moves, then snap back when momentum shifted. Like watching the ocean pull back before a big set arrives.
Getting Out of My Own Way
Here's what nobody tells you about trading: your biggest enemy paddles out with you every morning. Crypto's wild swings trigger every emotion—greed when prices rocket, panic when they crash.
FOMO nearly wrecked me more than once. I'd see a coin pumping and jump in without thinking, usually right before it collapsed. The cure? A simple checklist I'd run through before every trade. No exceptions, no "just this once".
My trading journal became my reality check. I'd record not just the trade setup but how I felt—excited, nervous, revenge-trading after losses. Reading those entries later showed clear patterns: my worst trades happened when emotions drove the decision.
The game-changer was treating each trade like equipment maintenance, not personal validation. Check your setup, follow your rules, execute the plan. Emotions can watch from the beach.
These three shifts—solid rules, visual pattern reading, and emotional discipline—finally turned my theoretical knowledge into actual results. The crypto ocean started making sense. WaveTrader became my constant companion, transforming confusing market data into readable wave patterns that guided my decisions.
What Two Years of Wave Reading Actually Revealed
Two years of systematic data collection uncovered patterns that flipped conventional trading wisdom on its head. The numbers told stories most traders never hear.
When the Market Actually Moves
Each timeframe revealed its own personality. The 1-minute and 5-minute charts suited scalpers hunting quick gains from tiny price shifts. But the 4-hour timeframe became my sweet spot—delivering the cleanest signals for swing trading while filtering out the noise.
Here's what caught me off guard: peak trading activity hits between 10 AM and 11 AM EST, when European afternoon sessions crash into US market opens. This single timing insight improved my entry points more than any indicator tweak. It's like knowing exactly when the tide changes at your local break—timing is everything.
Reading the Market's True Language
The best approach to studying crypto markets? Layer multiple analytical methods instead of betting everything on one system. Research shows the field is shifting toward practical applications—AI-driven prediction and automated trading tools are reshaping how we read market movements.
Visual pattern recognition proved incredibly effective for understanding market psychology. WaveTrader's approach of converting complex data into visual waves helped me spot patterns intuitively—like reading ocean swells before choosing which one to ride.
The magic ratio: 1:4 or 1:6 between timeframes works exceptionally well. I'd use 1-hour charts for entries while watching 4-hour charts for the bigger trend picture. This multi-timeframe analysis, combined with visual patterns, created a robust trading system.
Patience Pays Better Than Speed
The most valuable discovery from my data? Patience compounds returns exponentially in crypto. The "HODL" concept proved valid—investors who held strong positions through extreme volatility often scored massive gains.
Discipline separated winners from losers every single time. A striking 73% of U.S. crypto holders plan to keep investing through 2025, showing widespread adoption of long-term thinking over quick speculation.
The golden rule remained unbreakable: never risk more than 1-2% of capital on any single trading day. This simple discipline protected against crypto's wild swings while allowing steady compounded growth. It's the difference between surfing for years versus getting injured on your first big wave.
Lessons for Fellow Wave Riders
After two years of riding crypto's wildest swells and weathering some brutal wipeouts, here's what I wish someone had told me before I first paddled out.
Start small and track everything
Jump in with money you can actually lose—experts suggest risking no more than 1-2% of your capital per trade. The ocean doesn't care about your bills.
The most powerful tool in my arsenal? A detailed trading journal. Not just what you bought and sold, but why you made each move. Document these essentials:
- 📝 Entry and exit points with your reasoning
- 📝 Your emotional state during decisions
- 📝 What worked, what didn't, and why
Your journal becomes your personal wave report—showing patterns in your decision-making that charts can't reveal.
Let visual tools do the heavy lifting
Candlestick charts show you the market's pulse—open, close, high, and low prices for any timeframe. But here's where it gets interesting: visual tools like WaveTrader turned my analysis from homework into intuition.
Complex market data became as readable as ocean swells. Visual clarity catches signals that raw numbers miss. Why strain your brain tracking five indicators when one clean visual tells the whole story?
The WaveTrader app specifically excels at this—converting overwhelming data streams into surfable wave patterns. Instead of staring at confusing charts, you see clear Paddle Zones for entries and Wipeout Zones for exits. It's the difference between reading a weather map and actually feeling the wind on your face.
Duck under these beginner wipeouts
Emotional trading kills accounts. Panic selling during dips, then buying back higher? That's not trading—that's paying expensive tuition.
Security isn't optional. Enable two-factor authentication and stick to reputable platforms. The crypto ocean has sharks.
Overtrading burns capital fast. Making ten trades because you're excited or trying to recover losses? Recipe for disaster.
Remember: crypto markets are highly speculative waters. Do your homework before paddling in—don't just follow the crowd chasing every trending wave. Whether you're analyzing ABC correction patterns or simple support levels, preparation beats speculation every time.
The best surfers wait for the right conditions. Same goes for crypto.
🤔 Frequently Asked Questions
What's the most important lesson from 2 years of crypto trading?
Visual pattern recognition beats complex mathematical indicators. After testing dozens of strategies, I found that tools like WaveTrader that convert market data into visual waves made decision-making intuitive rather than analytical. Combined with strict risk management (never risking more than 1-2% per trade), this approach delivered consistent results.
Which technical indicators actually work for crypto trading?
The RSI-Bollinger Bands combination proved most reliable, especially on 4-hour timeframes. RSI identifies overbought/oversold conditions while Bollinger Bands show volatility extremes. When both align, success rates improve significantly. However, visual trading tools that show these patterns as waves often work better than traditional indicators.
How much money do you need to start crypto trading effectively?
Start with money you can afford to lose - even $100 provides valuable learning experience. More important than the amount is proper position sizing: never risk more than 1-2% of your capital per trade. Focus on skill development first, profits second. My data shows patience and discipline matter more than initial capital.
What's the biggest mistake new crypto traders make?
Chasing hype and FOMO trading destroyed more accounts than any other factor. Over 70% of traders lose money following trends without analysis. Other critical mistakes include overleveraging, ignoring stop-losses, and overfitting strategies to historical data. Emotional trading, especially revenge trading after losses, consistently leads to account blowouts.
Should I use automated trading bots or manual trading?
Both have merits, but visual pattern recognition often outperforms pure automation. Automated backtesting helps eliminate weak strategies quickly, but manual execution with visual tools like WaveTrader allows for market context that bots miss. The best approach combines automated alerts with manual decision-making based on visual patterns.
Riding the Waves Forward
Two years of studying crypto markets taught me something counterintuitive: the most powerful trading tool isn't another indicator—it's learning to see market patterns the way a surfer reads ocean swells.
Traditional technical analysis drowns beginners in mathematical complexity. Visual trading changed everything. When market momentum became as recognizable as approaching waves, decision-making shifted from guesswork to pattern recognition. WaveTrader's ocean metaphors didn't just simplify the charts—they made market psychology visible.
The hardest lessons came from spectacular failures. Chasing hype cost me more than missing opportunities. Overfitting strategies that worked perfectly on paper crashed against live market reality. Yet these painful experiences revealed the truth: crypto trading isn't about finding perfect signals—it's about building consistent processes that survive different market conditions.
What surprised me most? How much timing patterns mattered. The 4-hour charts delivered the most reliable signals. European-US market overlap created predictable activity spikes. Simple timeframe combinations outperformed complex algorithms.
Your crypto journey will likely follow a similar arc—from theory to painful practice to eventual consistency. Start small. Track everything, especially your emotional state during decisions. Visual tools will save you from indicator overload, but emotional discipline separates profitable traders from the statistics.
Risk management isn't negotiable. Keep position sizes small, maintain detailed journals, and remember that patience often beats speed in these markets. The volatility that makes headlines also creates genuine opportunities for those who learn to read the patterns correctly.
The crypto ocean keeps rolling, bringing new waves and fresh challenges. Success comes not from predicting every movement but from developing the skills to recognize which waves are worth riding—and knowing when to paddle back to shore.
Disclaimer: This article is for educational and informational purposes only. It does not constitute financial, investment, or trading advice. Cryptocurrency markets are volatile and carry significant risk. Past performance does not guarantee future results. Always do your own research and consider consulting a qualified financial advisor before making any investment decisions.